Around nine out of ten major construction projects worldwide finish over budget. We tend to look for the causes in technical complexity, the weather, kickbacks and the behaviour of contractors. These are all important factors, but they do not explain why cost overruns repeat from one project to the next. The explanation is simpler: the client and the contractor start out holding different amounts of information. Only the side that does the building truly understands the real cost and schedule, and as a rule it has no incentive to disclose that data. Opacity here is not a disease of the industry but its business model. And any information advantage works only for as long as the information stays hidden.
The history of other industries shows what happens next. Before Uber, only the taxi driver knew the price of a ride, and the passenger depended on his decision. The moment the route and the fare became visible on a screen, the driver's advantage vanished. Booking made hotel prices transparent, marketplaces did the same for goods, and Google Maps for logistics. Construction is still one of the few large markets built "like taxis before Uber": only one side holds the full picture of cost and schedule, and the other pays for that asymmetry in overruns.

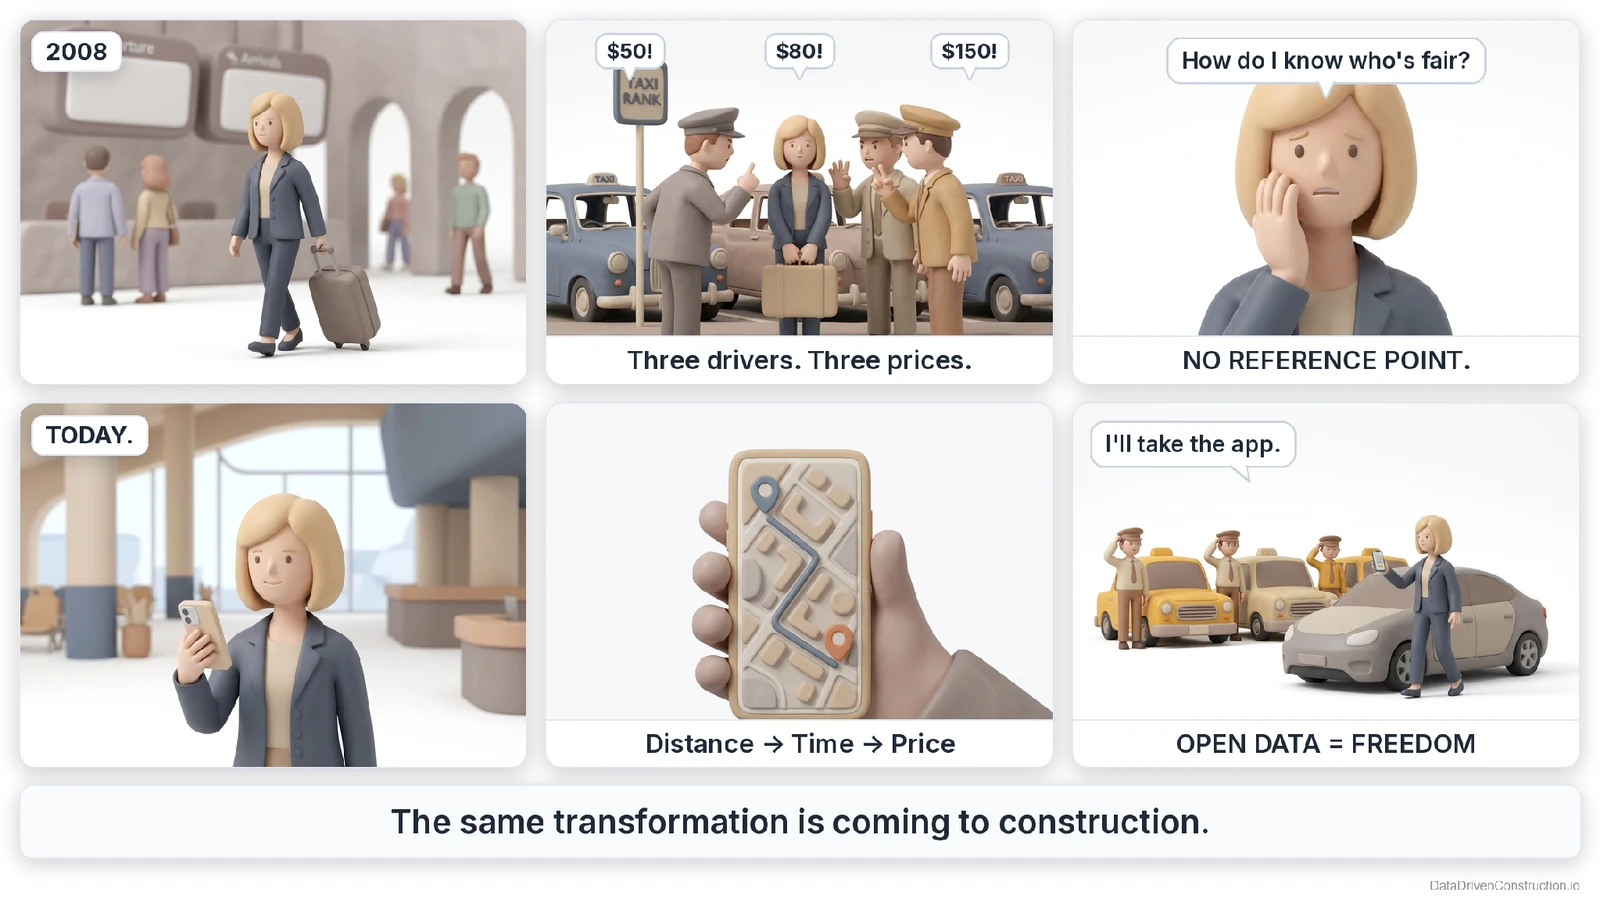
Copying Uber directly (an app where the client immediately sees an honest price) will not work: construction will not fold into a single button overnight. Behind Uber's button hides the complex logic of finding the shortest route among thousands of options, and it rests on something construction does not yet have: a unit, identical for everyone, for the length, difficulty and duration of a journey, expressed through kilometres and minutes.
A building can be constructed in a hundred thousand ways: which works, in which sequence, with which crews and which machinery, and the whole question is which route the builder chooses. Price here is not a unit of measurement: not per m², not per cubic metre, not through some coefficient - these differ for everyone and guarantee nothing. Work on site exists not as a price but as a sequence of actions: who does it, with what, for how long, under what conditions, with which materials and agreements, with which machinery, with which risks and dependencies.
The only possible unit is the work itself, broken down into atoms - described through resources: the part of the price that can be verified and repeated rather than taken on faith. Humanity has repeatedly tried to move to "unit economics" in construction and invented it again and again, from Sumerian scribes to the state work-rate setters of the twentieth century, compressing the experience of thousands of building projects into a handful of numbers in a table, written so that anyone could use them. The Western market did not lose this knowledge but moved it behind paid access and closed formats: detailed resource databases exist, but an open, shared norm that the client could simply take and recalculate for themselves does not.
Modern construction loses not because estimators are bad, managers lazy and contractors cannot use Excel. It loses because in most projects the work has no "recipe" variants for its processes in machine-readable form: a description intelligible not only to the site foreman but also to the computer. Today knowledge about the work lives in assorted unstructured formats, which means it can be neither calculated, nor compared, nor automated.
Uber, Amazon and Airbnb did not add a single new car, product or hotel to the world. Their contribution is a layer of data: they connected supply and demand and made both the price and the route to it transparent. Drivers, hotels and shops did not go anywhere, but those who controlled the information lost their monopoly within a few short years. In construction this layer is only just forming. And beneath it should lie not yet another handsome 3D model, nor merely a price book for works, but a description of what work is made of: resources and their variants, crew composition, output rate, conditions, duration, losses.
A labour and time norm, open and the same for everyone, protects each party: the client from an inflated price, the contractor from a punishing deadline he signed up to blind, the worker from the crunch that someone else's mistake in the estimate drives him into. This article is about the layer of data that needs to be built to underpin it.
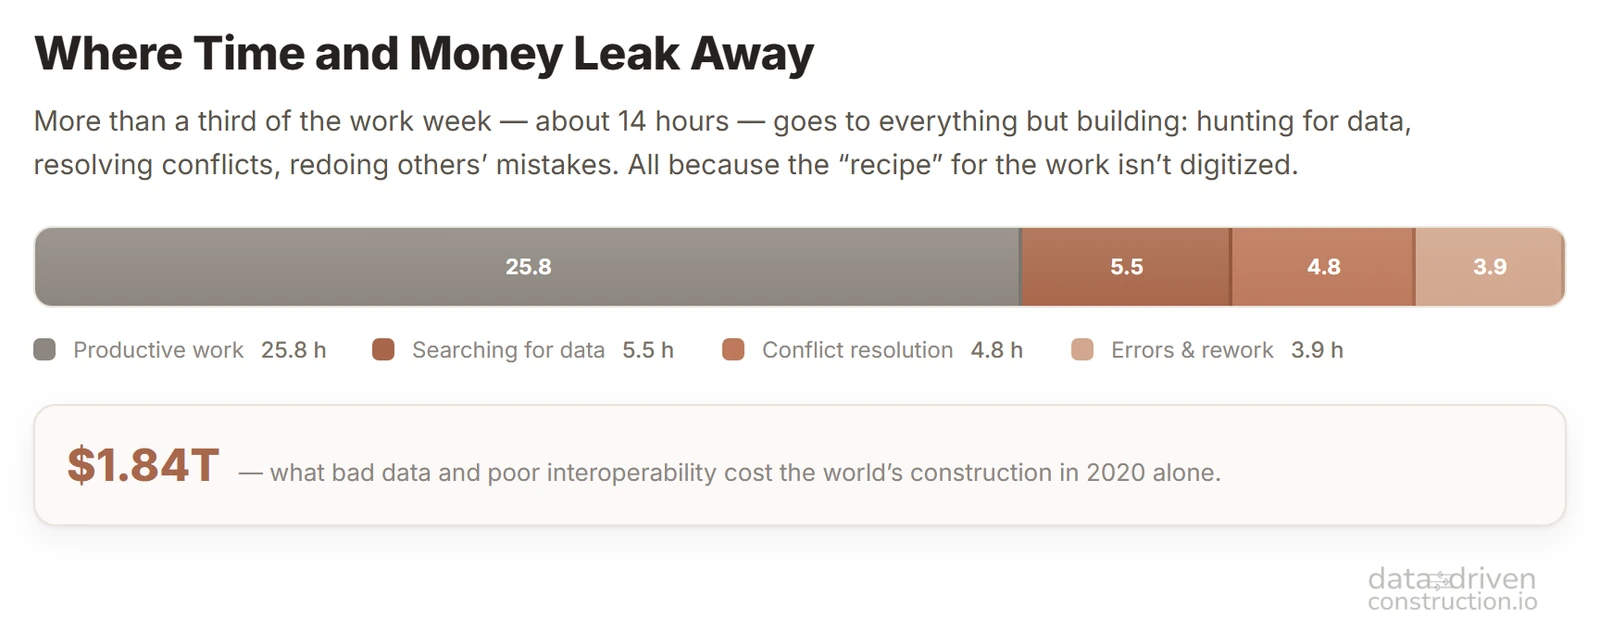
This article grew out of my work on an open database of construction unit rates from different countries and out of the chapter on cost estimates and calculation in the book Data-Driven Construction. In part it is also a personal story. My father was a site foreman on land-reclamation works, and I still remember how in the evenings he would sit with an engineering calculator and recompute quantities and costs by hand, converting cubic metres of soil into money. This article is not about the calculator in a foreman's hands but about open data and how geometry and quantities turn into cost, and why access to that very logic is today, for the client, in many ways more closed than it was 150 years ago, and how that is finally changing.
Further on in the article: a Dutch construction cartel with double-entry books and 1,300 fined firms; algorithms that find traces of collusion right in the numbers of tenders; two billion dollars of SoftBank money burned on an "Uber button for construction"; and a housing market that has already been through its own uberization. Through this history and these patterns you can see what the tools for uberizing the construction industry will look like in the coming decades.
Contents
Why construction goes over budget
Why do construction projects so often go over budget, and why is an inflated estimate almost impossible to prove? Because the client has nothing to compare the quoted price against.
Uberization comes to construction
Construction has more information asymmetry than taxis did before Uber. The real cost and schedule are known to the contractor, the estimator and the buyer. The client knows almost nothing. He arrives with money and a design, he is quoted a price and a deadline, he agrees, and a year later he discovers that the budget has grown by 30% (and more often, several times over), change orders have appeared and the schedule has slipped.
In most projects, the management of construction processes rests on "the opinion of the highest-paid person in the room" (HiPPO, Highest Paid Person's Opinion), who runs the project by hand, juggling numbers (more on this in the DataDrivenConstruction book).

There is no ill intent in this. In many companies the estimating, costing and budgeting departments, together with their calculations and coefficients, are closed off from outsiders and even from the firm's own other staff, because they are exactly where the thing that holds up the margin sits. And part of the "coefficients" that raise the price of works is not profiteering but rather insurance. The contractor signs a fixed price on a project that, thanks to poor design, is still full of holes; in effect he lends money to the build between payment certificates, since the advance is cut back, the money arrives in 60-120 days, and a further 5-10% is retained until the end of the warranty period; and all the while he is obliged to hold the budget when steel rises in price by half over a year, as in 2021, and the project can no longer be pushed "to another quarter".
The contract dumps these risks onto the contractor, and he hides his reserve in the unit rates, simply because there is nowhere else to hide it. The opacity of estimate calculations grows in large part out of the opacity of the rules of the game. An open norm does not abolish this insurance but brings it almost entirely out of the shadows: when the norm and the indices are visible to both sides, the secret coefficient turns into an honest contractual clause on indexation and inflation tied to the specific resources of the works, and the contractor no longer has to fear a cash-flow gap or put the company on the line with every signature.
The idea of uberizing construction is that the client should gain a "Google Maps for construction": a tool that, before the project starts, shows a realistic route to the price - a corridor of cost, schedule and risk based on industry standards and market data rather than the contractor's promises. It is not the contractor who sets the route and the fare; instead an independent platform shows the market corridor, the timing characteristics and the likely deviations.

Why, then, does construction still live without its own Uber, while taxis, hotels, retail and the delivery of food and goods have long since been "uberized"?
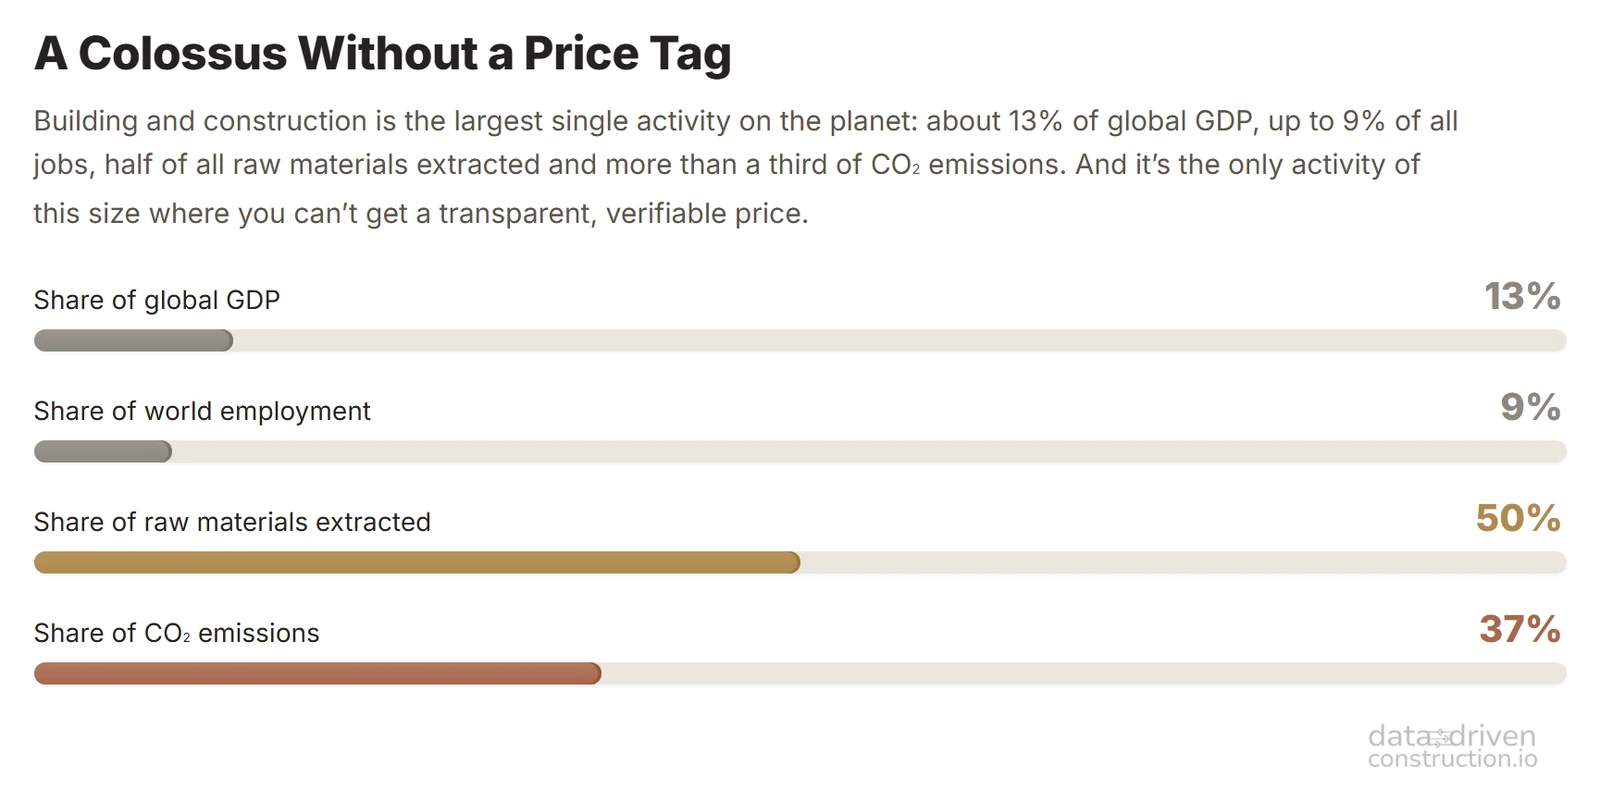
Construction remains one of the largest industries in the world economy. By gross output, together with the entire chain of buildings and real estate, it is about \$12 trillion a year and around 13% of global GDP (counting only the value added by construction itself, closer to 6%). But even on the lower estimate that is many times larger than the entire hotel market on the planet (~\$1.5 trillion) and tens of times larger than the global taxi market (~\$0.2 trillion), the very industries that have already been through their own uberization.
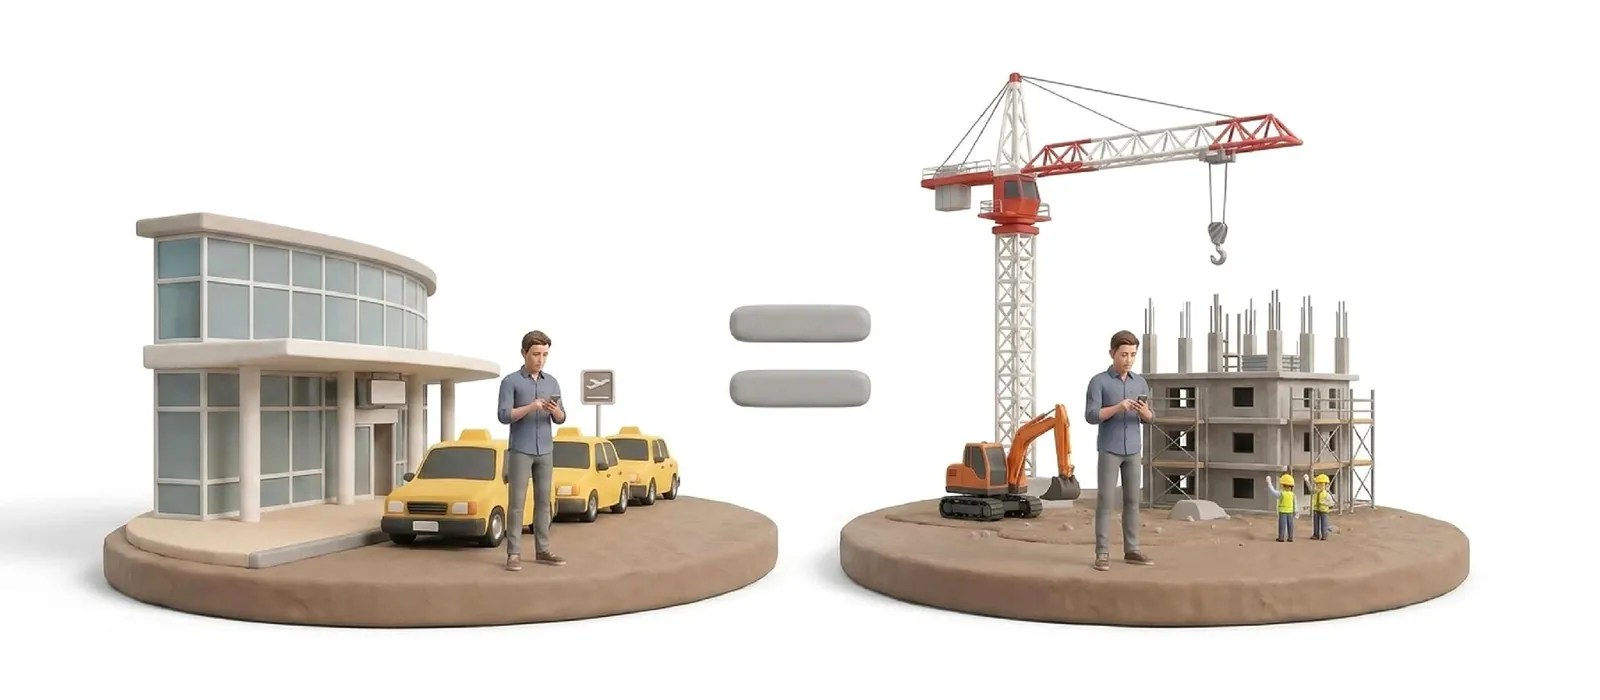
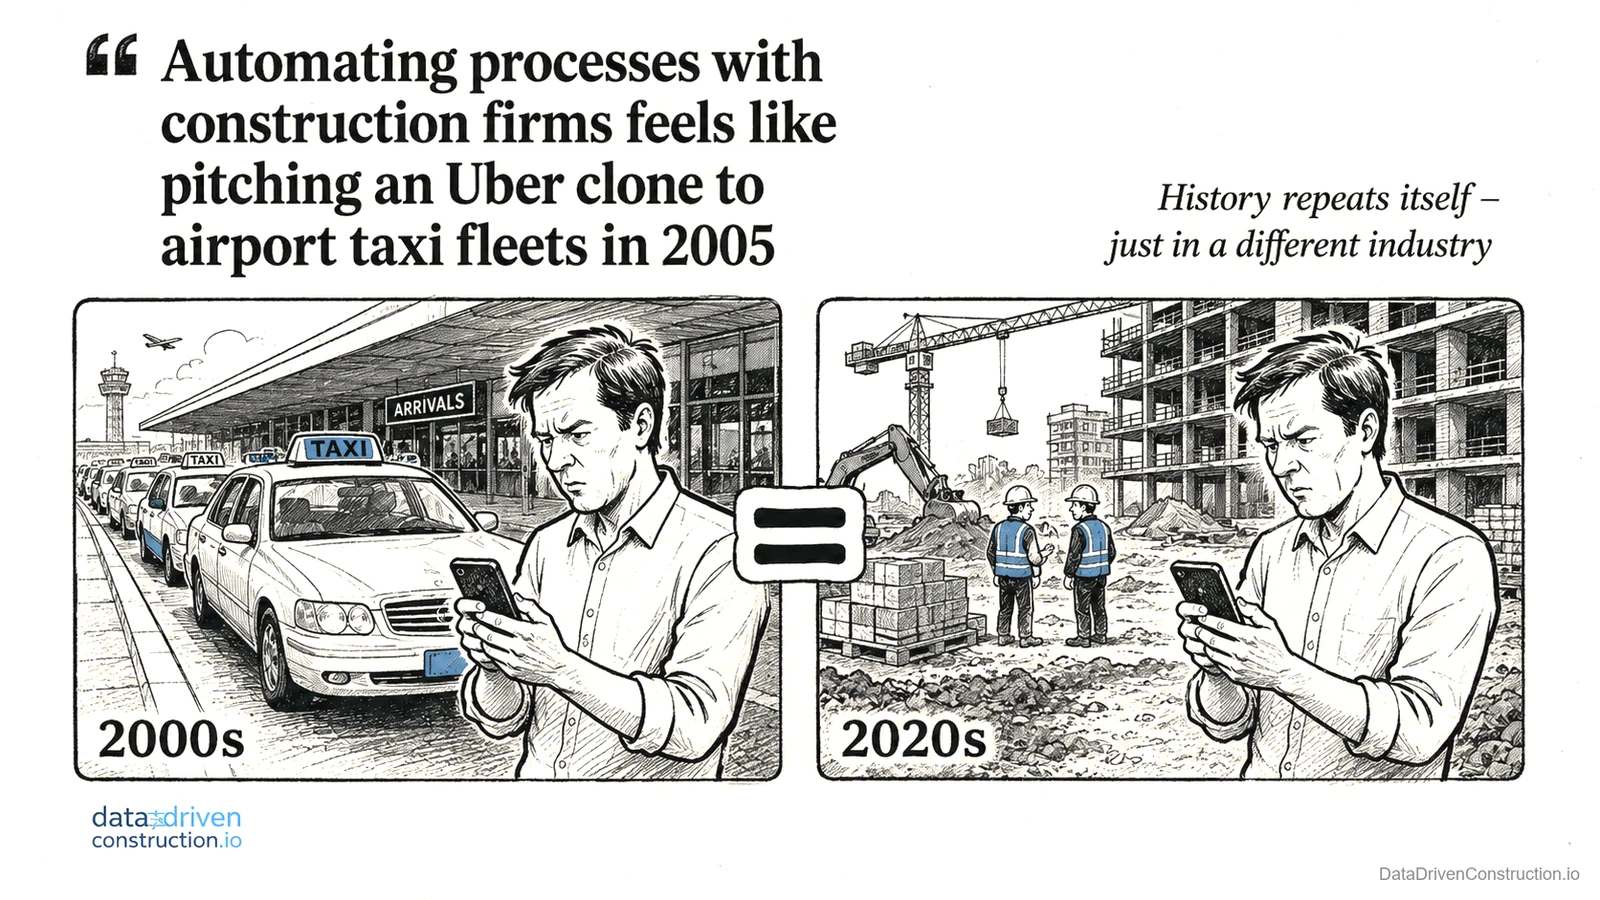
And the construction industry itself is not ready to be uberized: working with construction companies on automating and opening up their processes, estimates included, is in many ways like trying to build an Uber for the taxi drivers of an airport cab rank in 2005. Transparency of data and processes is not wanted by those who make their money from information being closed. Wherever it comes to real cost and schedule, the contractor is in no hurry to automate the calculation, because on a subconscious level he understands that it would expose the whole kitchen of coefficients and bury a shaky business that has been built up over decades.
"In the long run, the construction companies that dominate the market today, setting the standards of price and service quality, may lose their role as the key intermediary between the client and his construction project." - from the Data-Driven Construction book
An "Uber for construction" has already been attempted by the American startup Katerra, which raised more than \$2 billion in investment and went bankrupt in 2021. Katerra was killed not by transparency but by the attempt to hide construction behind a single button.
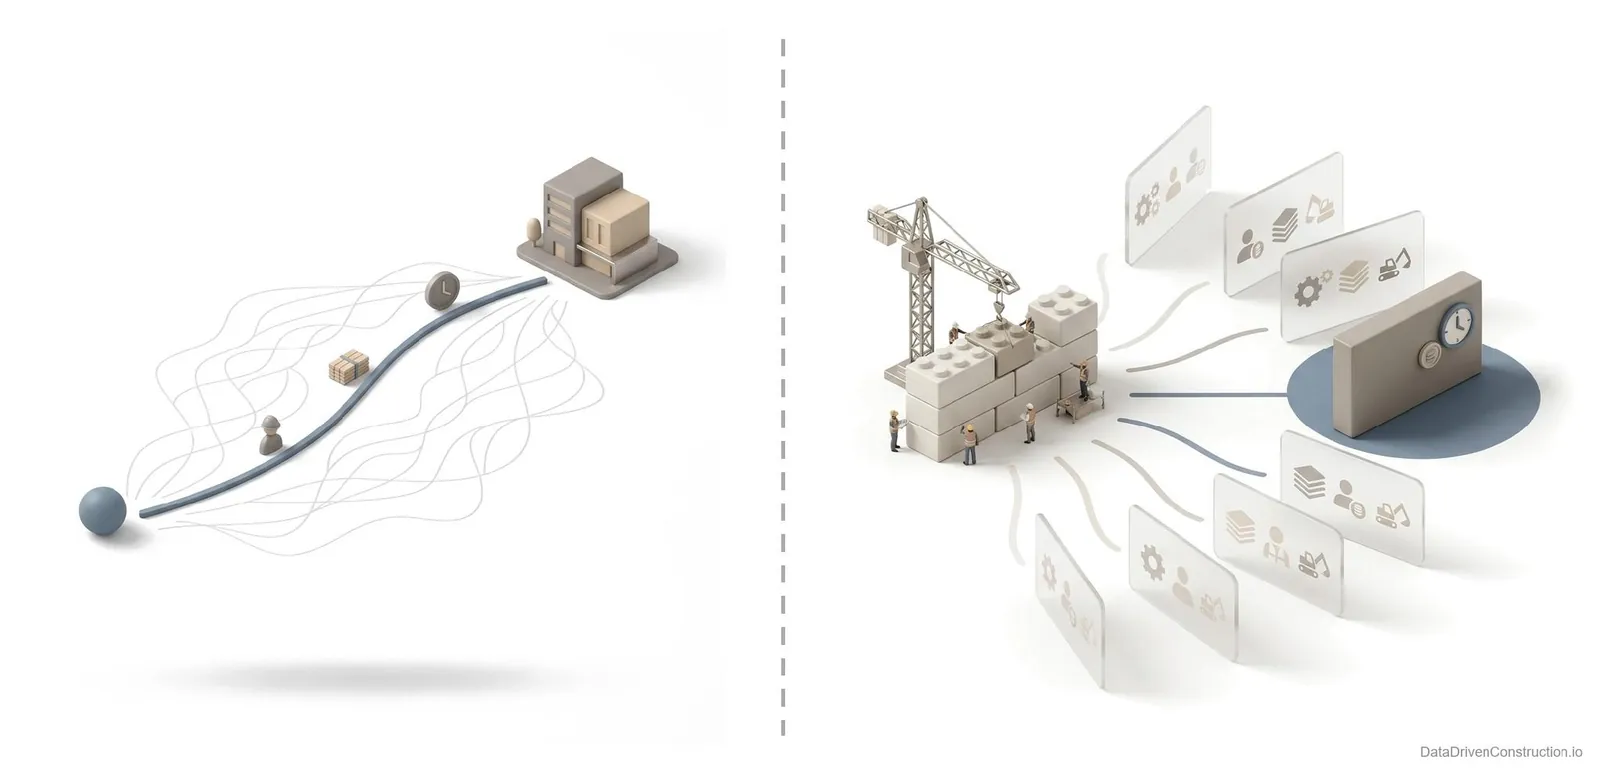
Uber gained a foundation that construction still lacks: a standard, transparent unit of measurement that is the same for everyone. The path from point A to point B (3D) can now be measured in kilometres and time (4D) with a few clicks, and in the end a ride costs an understandable amount per kilometre and minute (5D), roughly the same for all drivers and passengers. So what is that unit in construction?
That unit has to be the resource norm of work: how much labour, material and machine time a unit of work requires. A norm, not a price: a price cannot be verified, but a norm can, and an "Uber for construction" can grow only on verifiable numbers. Today, though, it looks more like the local hundreds of thousands of different units and standards of pre-revolutionary France, which we will discuss below (Chapter 6: six civilizations, one answer).
Between the starting point A and the result B there is more than one path, and the navigator does not guess but searches for an efficient one among thousands of options. Construction works the same way, only at a higher dimensionality: thousands of combinations of resources, crews, sequences and schedules lead to one and the same building, and there is no "single correct" one among them. That is why the platform should not name one exact price but show a corridor of probable outcomes and search within it for the best path.
To build the uberization of construction, we will first have to work through a few things: what a corridor of probable outcomes is and how it is built on resources, what a resource norm is, where it came from and why today it is so often missing. But first, about what the absence of this unit is costing the industry right now.
The iron law: nine out of ten
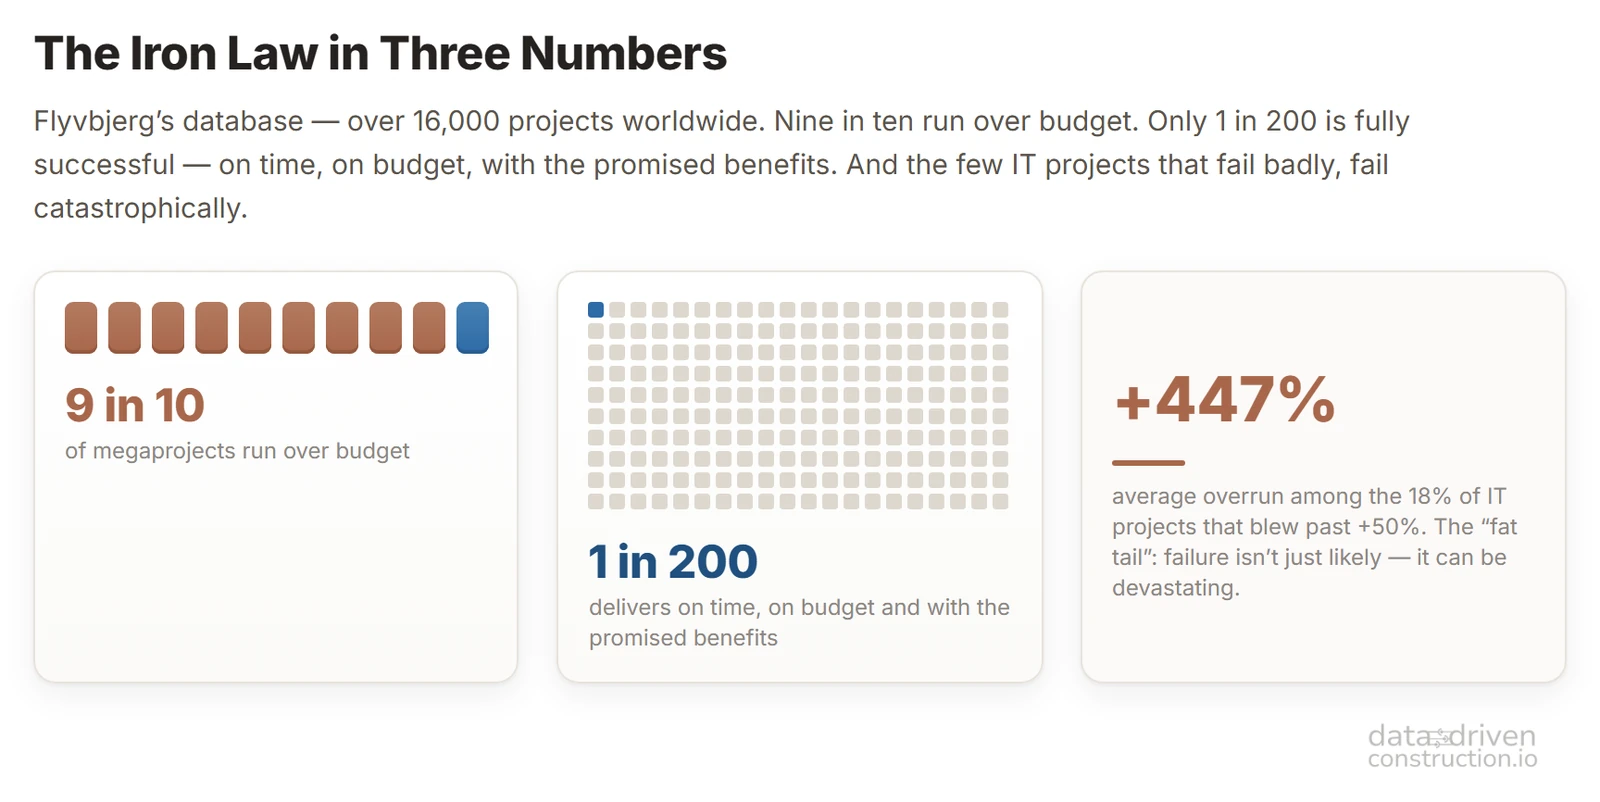
"Nine out of ten such (large construction ones - author's note) projects run over budget. Overruns of up to 50% in real terms are commonplace; above 50%, not uncommon." - Bent Flyvbjerg, What You Should Know about Megaprojects and Why (2014). Bent Flyvbjerg calls this the "iron law of megaprojects": over budget, over time, over and over again.
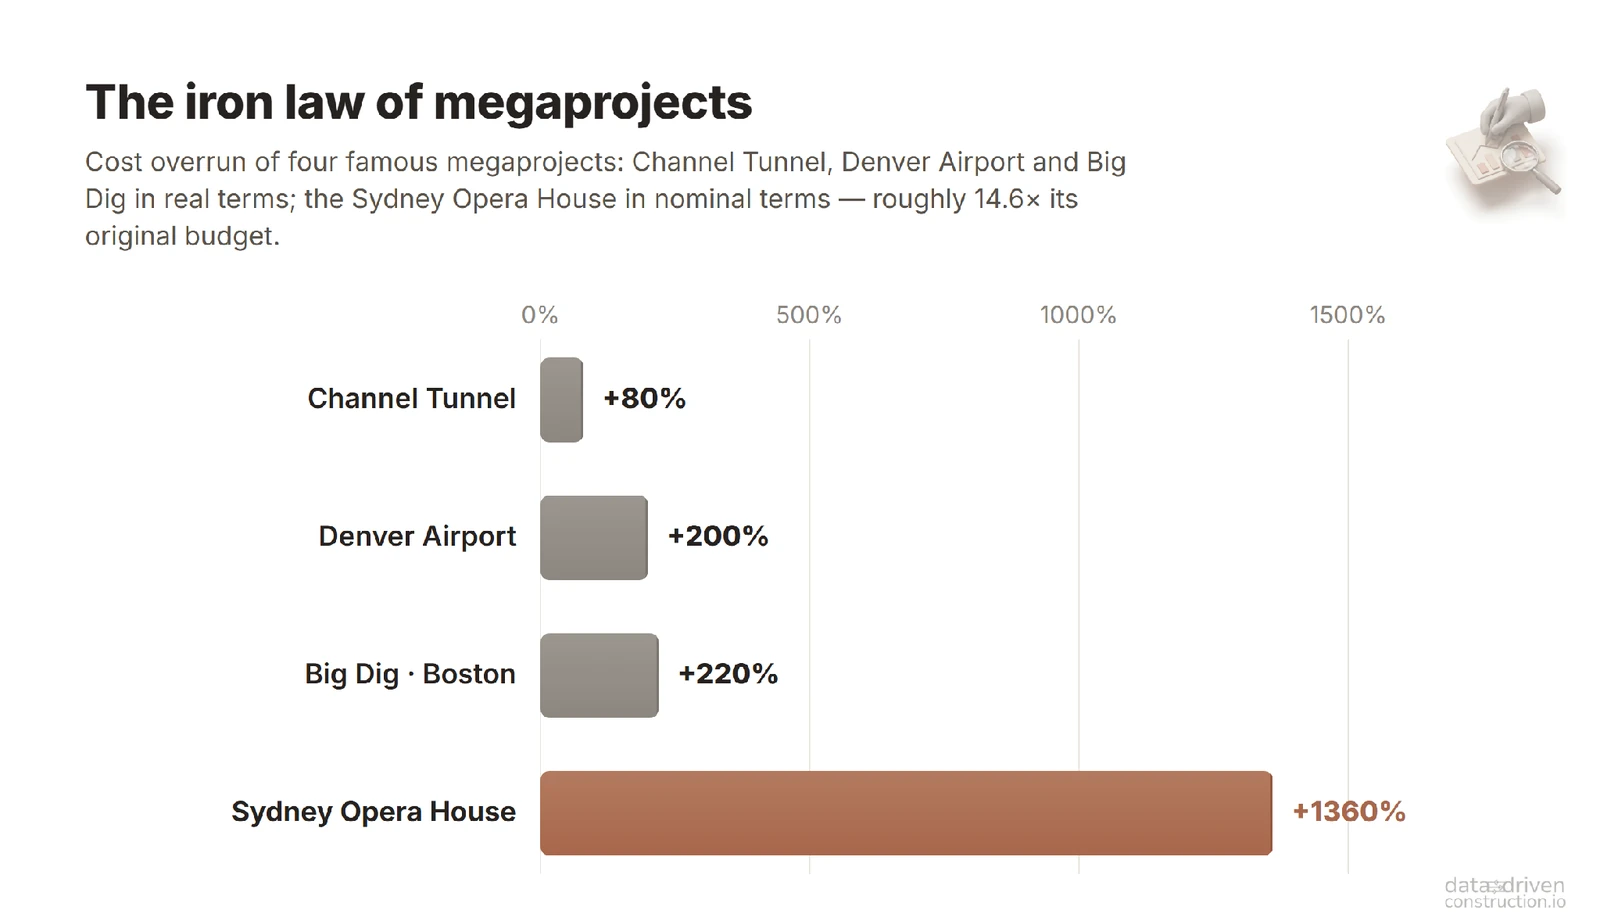
The concrete figures: Denver airport - around 200%, Boston's Big Dig - around 220%, and the Sydney Opera House - around 1400%; even adjusted for inflation, the overrun stays many times over. When Flyvbjerg and his co-author expanded the database to more than 16,000 projects across 136 countries, the picture grew harsher still:
"Only 8.5% of projects hit the target on both budget and schedule. And a tiny 0.5% hit it on budget, schedule and benefits. That is, 91.5% of projects run over budget, over schedule, or both." - Bent Flyvbjerg, Dan Gardner, How Big Things Get Done (2023).
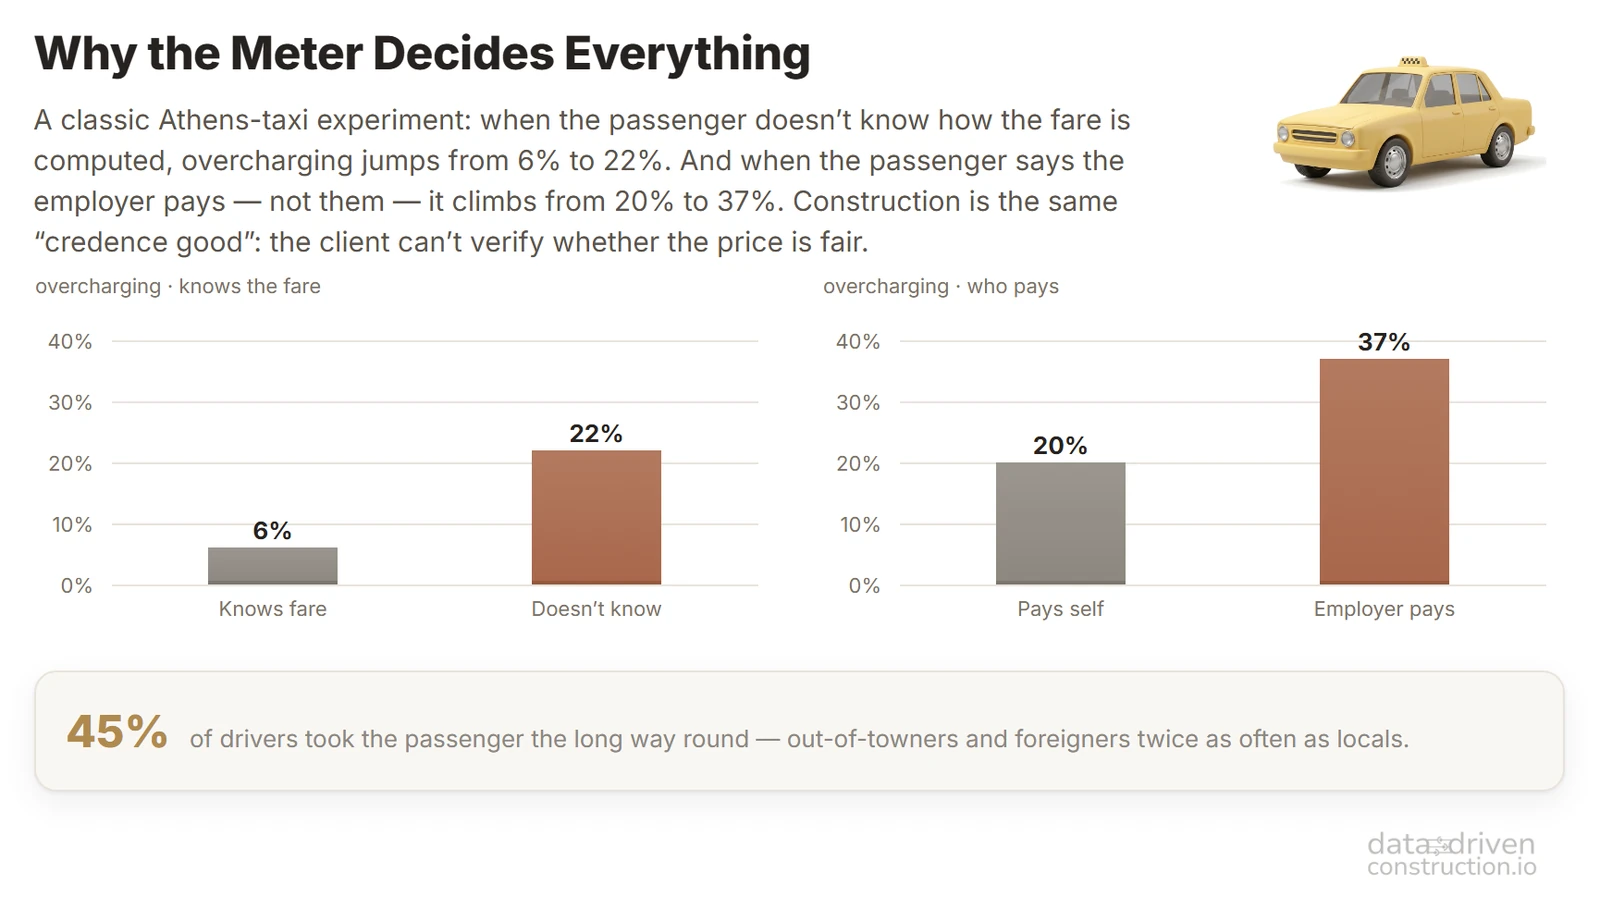
This is how every market behaves in which the client cannot see what the price is built from. In IT, the classic Standish Group report counted, back in 1994, only 16% of projects that came in on both schedule and budget, with an average overrun of 189% among the troubled ones. In any industry, before uberization set in, you can find figures like these. One of the first such industries was the taxi trade: in a field experiment in Athens, passengers who did not know the city or the fare were overcharged nearly four times as often - in roughly 22% of rides versus 6% for those who knew the fare. Economists called the pre-uberization taxi a "credence good": the client could not verify whether the price was honest, and it is precisely those unable to check who are cheated most often (Balafoutas et al., 2013). It was this asymmetry that Uber removed: when an algorithm, not the driver, computes the route and the fare, there is nothing left to overcharge on. Before work begins, the client cannot verify the estimate, and in that "before-the-fact" blindness construction behaves like the largest and most closed of such markets.
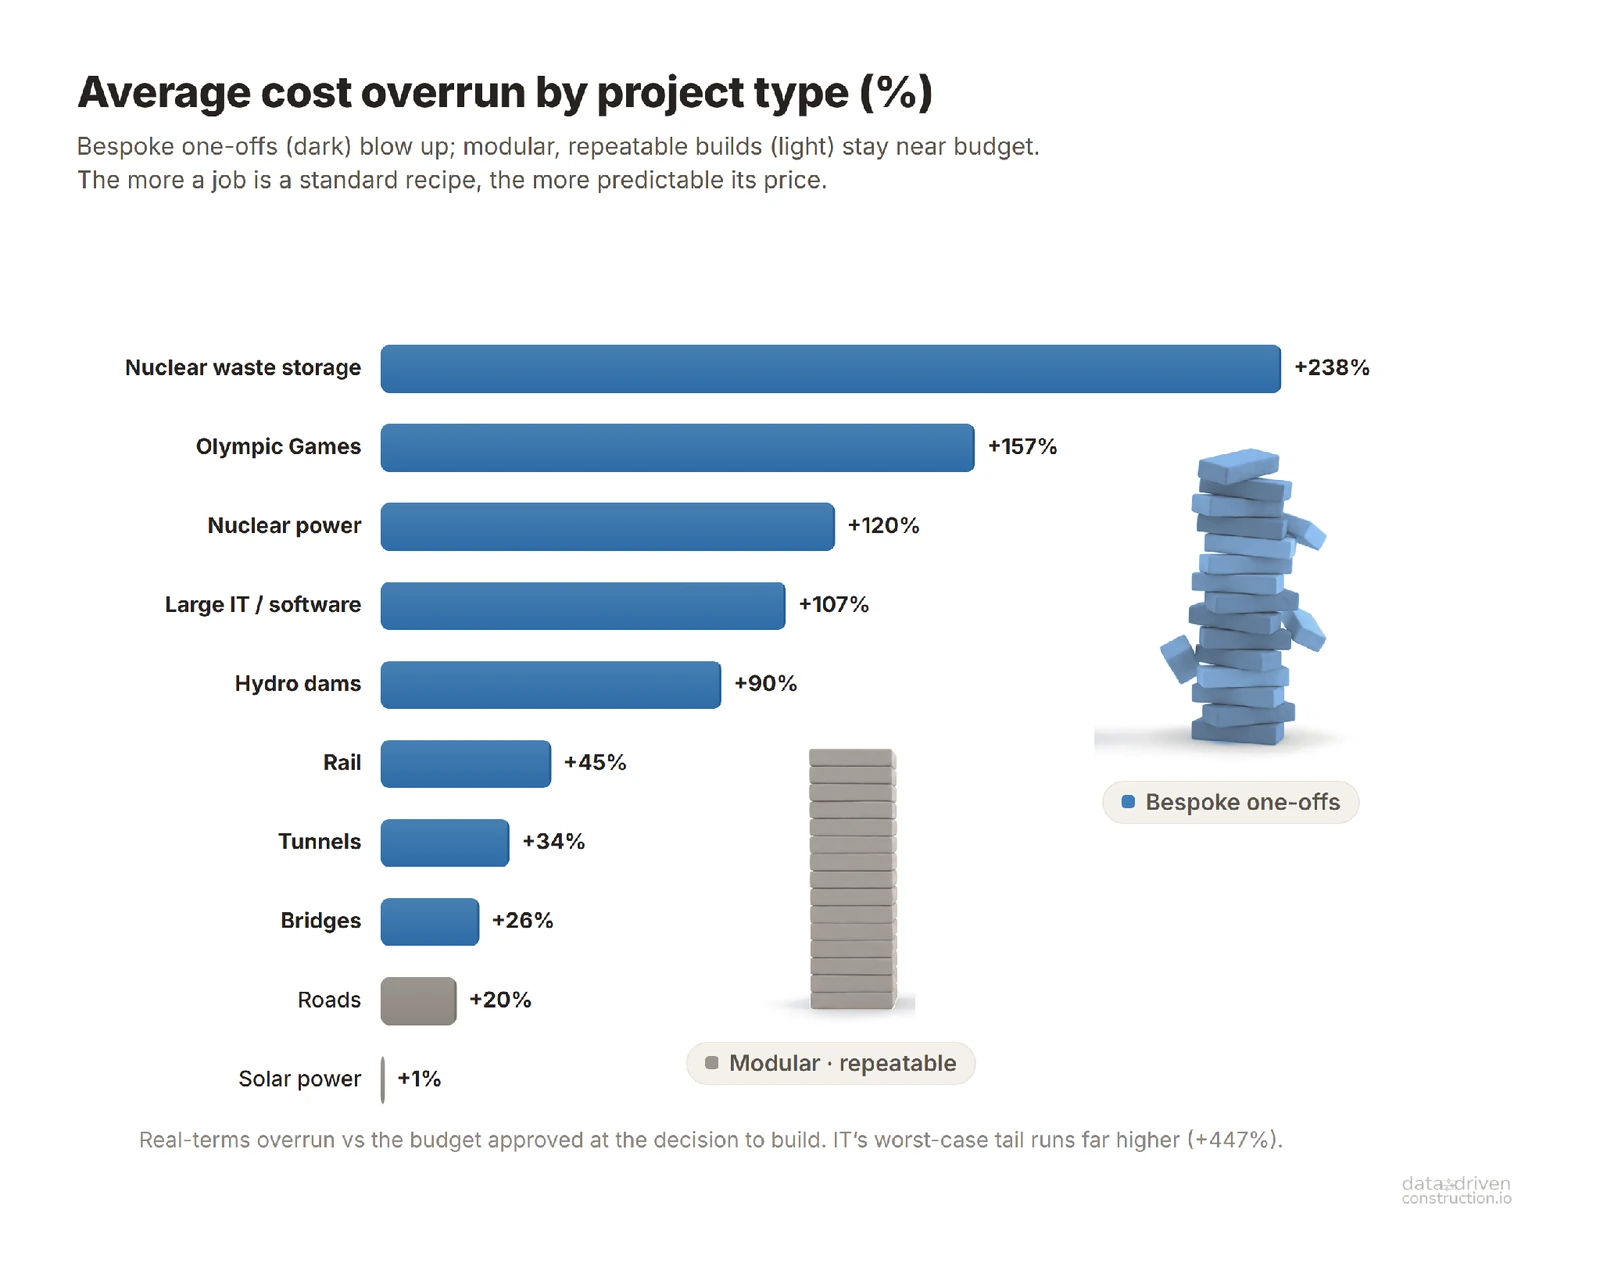
The spread by infrastructure type: railways run over budget by 44.7% on average, bridges and tunnels by 33.8%, roads by 20.4% (Flyvbjerg's classic data on 258 projects; McKinsey reports the same orders of magnitude).
Over the past decades, neither CAD, nor BIM, nor AI has yet budged this statistic. Which means the problem lies not in the visualization tools and not in a shortage of computing power: over those decades both have grown many times over, yet the overrun curve has not changed. The problem runs deeper. Nine out of ten megaprojects go over budget because construction still measures the end result and models the geometry and prices the work in composite terms, but does not model the work itself and does not cost the project at the level of resources.
Why a flawed estimate cannot be caught red-handed
Nine out of ten is a consequence. Flyvbjerg explains the failures through two mechanisms: optimism bias (a sincere optimism in the estimates: we believe that "we, at least, will pull it off") and strategic misrepresentation (deliberately lowballing the estimate so the project gets approved) (Curbing Optimism Bias and Strategic Misrepresentation in Planning, 2008; Survival of the Unfittest, 2009). But why is a flawed estimate impossible to check at all?
Because most often it is made up of composite prices. "A square metre of partition - X euros." Where did this X come from? It shows neither the route of the logic nor the possible options: how many man-hours are in it? What crew composition, what labour grades? How much profile, how many drywall sheets, screws, tape are consumed, and what alternatives do these resources have? What output rate is built into the norm - 2 m² per hour or 4? If this data is missing, there is no way to argue with the estimate. And so optimism (optimism bias) and manipulation (strategic misrepresentation) live comfortably inside a single unverifiable figure.
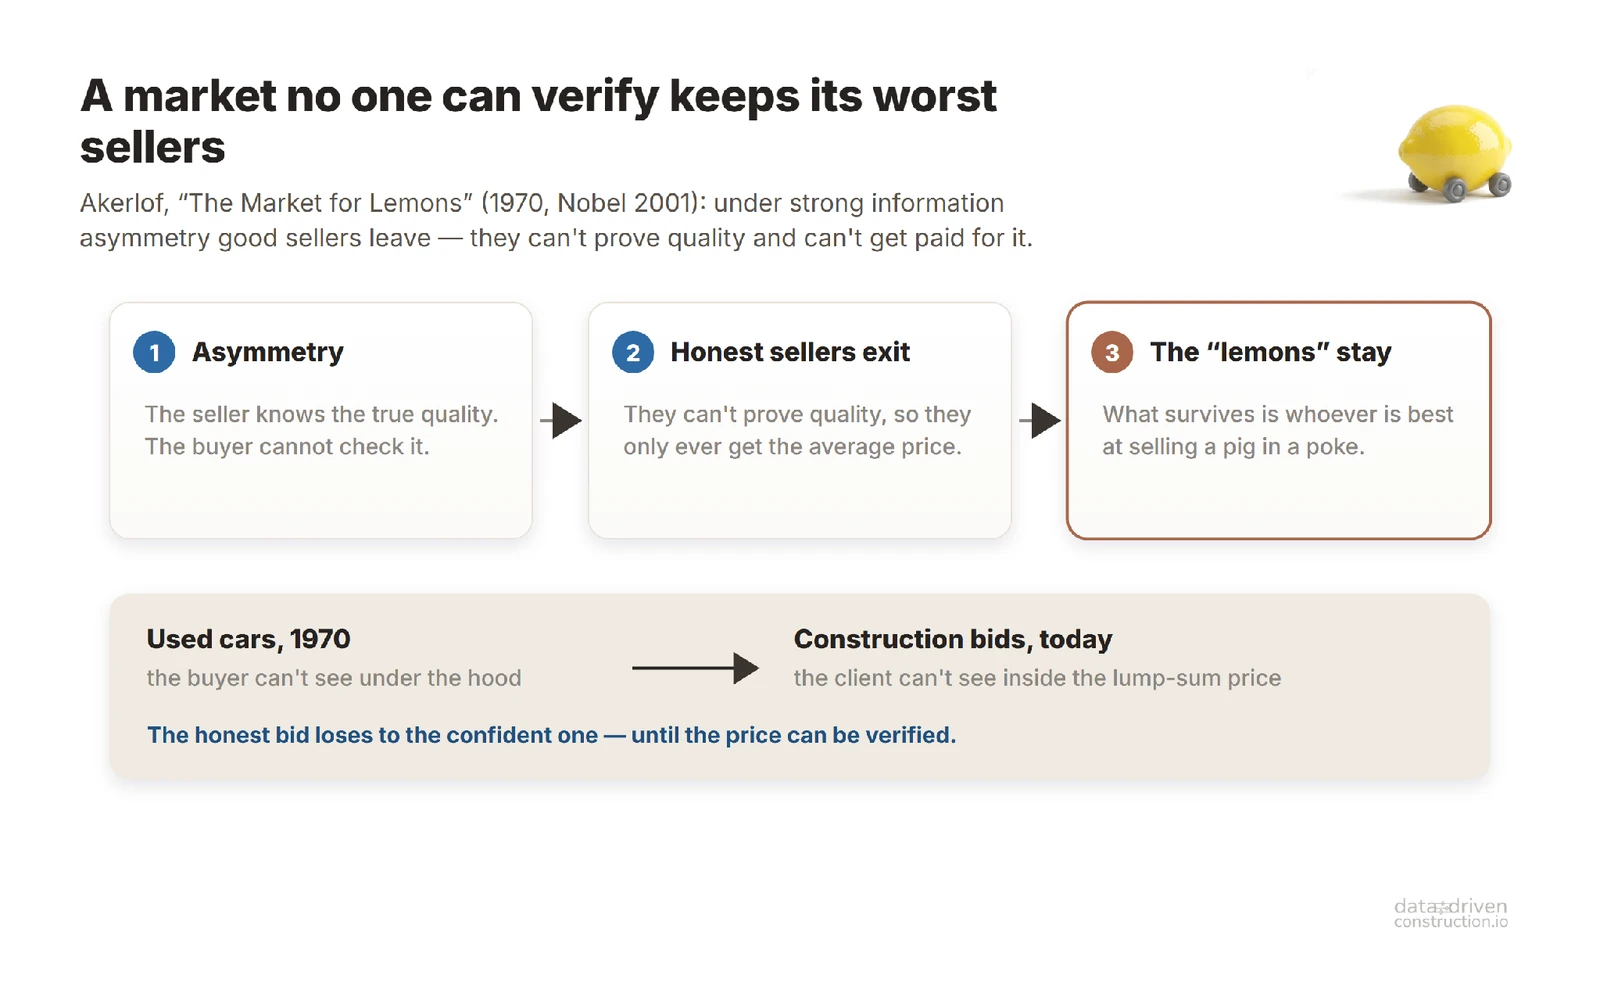
This defect has a name in economics. In 1970, George Akerlof published the paper "The Market for Lemons" about the used-car market, where the seller knows more about the goods than the buyer. The conclusion, for which he later received the Nobel Prize: under strong information asymmetry, a market degrades. Honest sellers leave, because they cannot prove quality and are not paid for it; what remains are those best at selling a pig in a poke. Information asymmetry is not an obstacle to the market but a separate, self-standing defect of it.
A construction tender in which the estimate cannot be checked works like that same "lemon" market: the winner is not the one who calculated more accurately, but the one who promised more boldly and more quickly. And the longer the price stays unverifiable, the fewer of those who estimate honestly and well remain in the market.
"Estimators often act as 'financial jugglers', trying to increase profit through various coefficients at the calculation stage." - from the DataDrivenConstruction book.
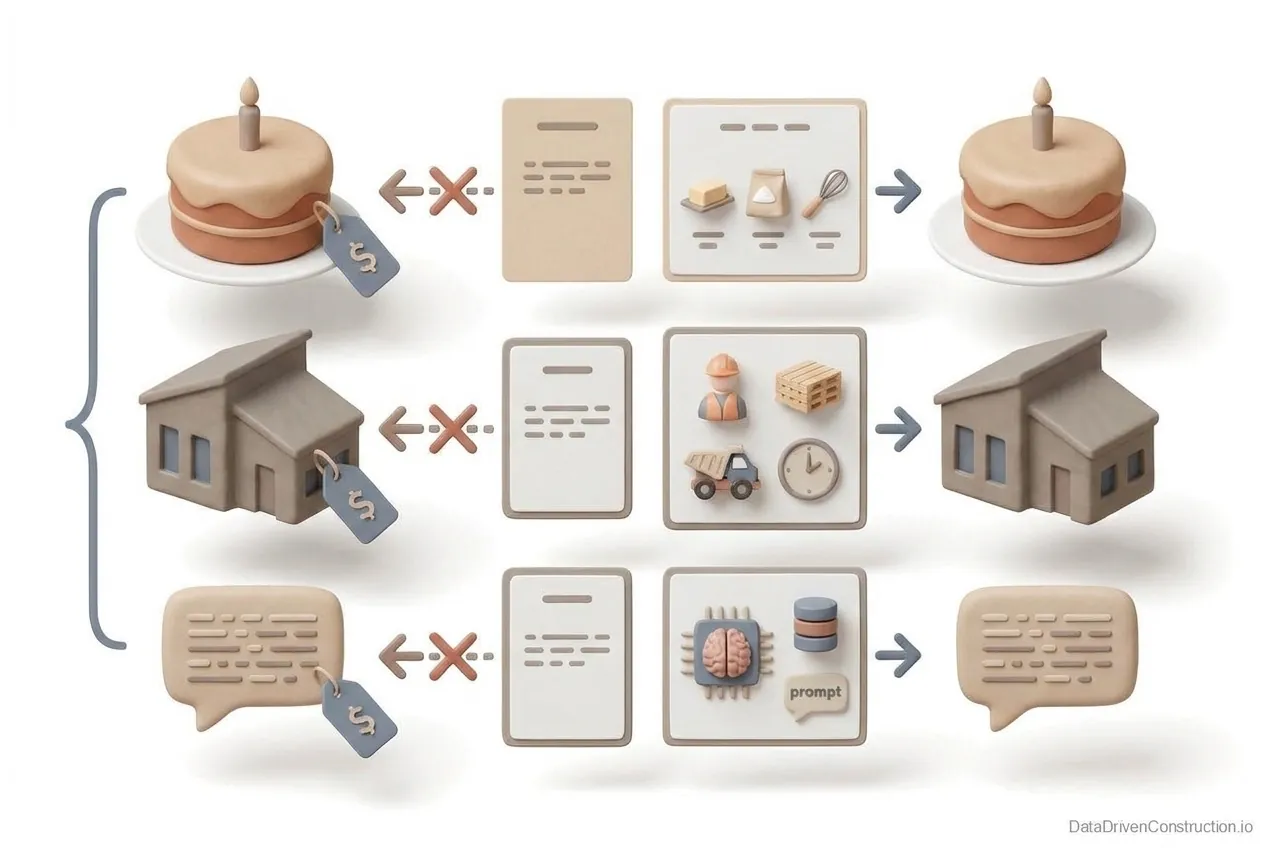
Estimators and managers are not to blame here: the real economics of the work on the construction site - at the level of resources - today exists mainly in the heads of the site foremen. This knowledge and these work "recipes" are not digitized and are handed down like a craft secret: orally, from master to apprentice. Just as, until recently, a cookbook of cake and salad recipes was handed down from mother to daughter.
A site foreman's experience is a recipe. The whole history of norm-setting comes down to a many-thousand-year attempt to turn that recipe into a standard: to draw the knowledge out and write it down so that anyone can use it.
The time norm in its modern form appeared with the arrival of factory clocks, when labour became "time-based": only once time became measurable and the same for everyone did it become possible to measure labour too. Measuring labour changes labour itself. A worker under a stopwatch works differently than one without it. That is why a norm is not a photograph of reality but a compromise between how people actually work and how everyone has agreed to count that they work.
From the standpoint of information theory, a norm is resistance to chaos. A construction site keeps sliding into disorder of its own accord: people make mistakes, materials rise in price and spoil, weather gets in the way, schedules drift. A norm "lowers entropy" and compresses the experience of hundreds of past builds into a few numbers, settling in advance part of the "how much, with what, and for how much" questions. This experience is recorded in two ways: as a composite price (for example, installing a drywall wall at a price per m²) or as a resource norm, with a full description of the resources and the work required.
The composite "price of the work (the dish)" and the resource norm describe one and the same work, but they are signals of different power. The price is a signal compressed to the limit, from which almost all the information about how the work is structured has been thrown out. A norm described through its resources is the full signal. Recovering the discarded information from a compressed signal is impossible: having received only the price, you can no longer unfold it back into resources, just as you cannot reconstruct a recipe from a dish already eaten.
The compression of experience into a norm has an exact modern relative. A trained LLM language model (ChatGPT, Claude, DeepSeek) is terabytes of read text pressed into a file of weights that can be copied onto any computer. A resource norm relates to construction work just as a model's weights relate to language: colossal experience compressed into a compact, portable form. Once assembled, a norm is copied across the whole industry without loss and almost for free. In this sense, the resource norm is the oldest specimen of what we today call "knowledge compression": people invented it thousands of years before neural networks, because the task was the same - to turn boundless experience into a few numbers that anyone can use.
If we draw the analogy with a route, the estimate is the map of the construction. And when the only thing on the map is a composite price per square metre, the map's scale (say, M 1:500000) turns out too coarse to navigate by: you cannot plot a route. You see that the object is "somewhere over there and costs about this much", but you do not see the roads and the logic by which that figure was reached.
A company with experienced site foremen will calculate not through a composite price of the work but through its own resource norms (M 1:10000), describing one and the same work precisely. The quality of a project's estimate is a function of whether the company has managed to assemble its own norms and standardize its processes.
"Historical data on the cost and duration of processes is gathered over the course of building past projects throughout the entire life of a construction company and is entered into the databases of various systems (ERP, BPM, EPM, etc.). The availability and quality of this data is the principal competitive advantage of any construction organization." - from the Data-Driven Construction book
Why, then, should each company have to mine and describe anew the knowledge that humanity has been systematically collecting for four thousand years already?
Four thousand years of the norm
The unit that construction is missing was invented long ago: for millennia, labour, materials and time were compiled into a table from which price is calculated rather than assigned. What follows is how this knowledge accumulated and why it still works.
Six civilizations, one answer
The resource norm was invented independently by every civilization that built at scale and at public expense, and the reason is always the same: large-scale construction without norms is unmanageable and defies honest accounting.

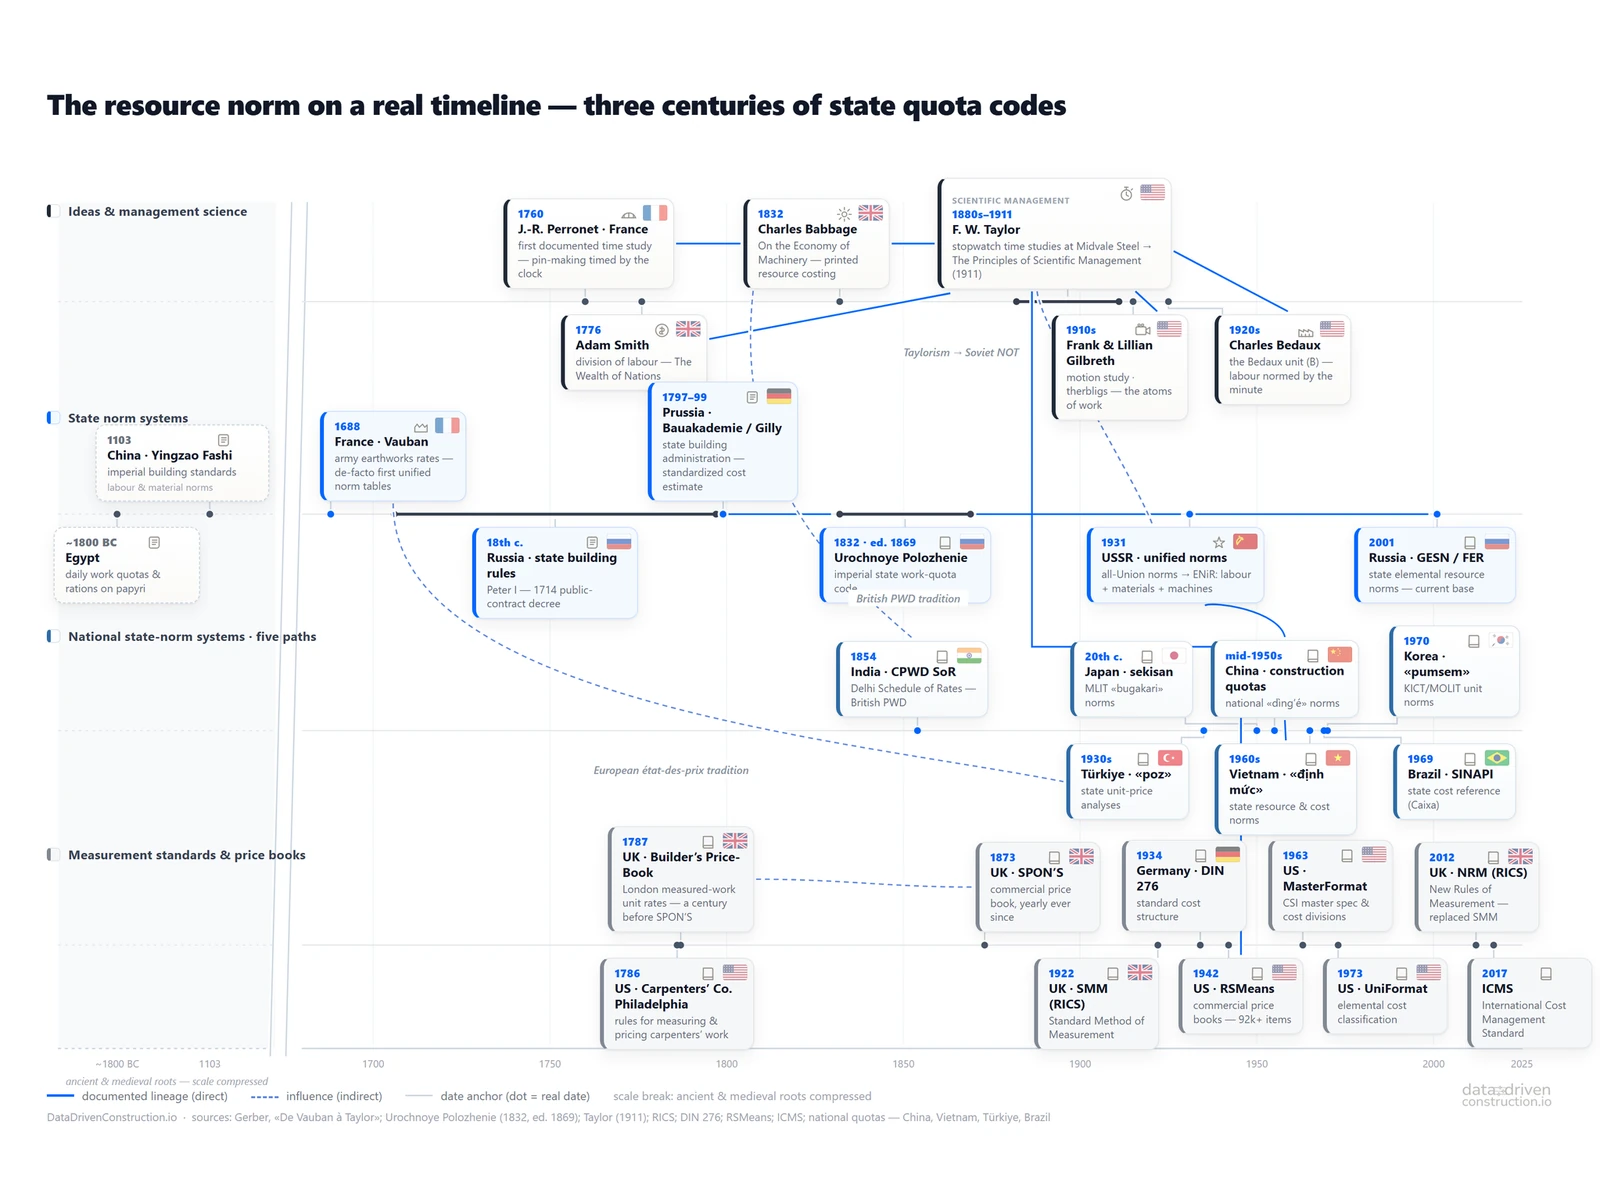
The earliest labour norms in history are recorded in cuneiform on Sumerian tablets from around 2100 BC. The Sumerian bureaucracy counted labour in man-days, set daily output rates (brick moulding, earth hauling) and reconciled a norm-versus-actual balance for each crew, carrying any shortfall forward as the worker's debt (Englund R., Hard Work - Where Will It Get You? (1991)). The Assyriologist Elinor Robson described Babylonian construction calculations literally as "quantity surveying", a quantity surveyor four thousand years before the profession existed.
Egyptian scribes did the same on papyrus: a third-century BC record survives giving the cost of painting different types of windows in a royal palace using the encaustic technique (the example is described in the book Data-Driven Construction). Even then the record "included the logic of calculating the quantity of materials, their cost and payment for the work performed" - the price was derived from resources, not named by eye.

Classical Athens added to this accounting something the palace scribes had lacked: publicity. The construction accounts of the Erechtheion temple on the Acropolis (inscriptions IG I³ 474-476, 409-407 BC) were carved on marble stelae item by item: an inventory of unfinished blocks, material purchases, piece-rate pay, workers named individually - citizen, slave - and who received how much. The stele, with the estimates chiselled into it, stood beside the temple, and any citizen could walk up and check where the public money had gone. Transparency of construction spending was not an option but a civic act, carved in stone.
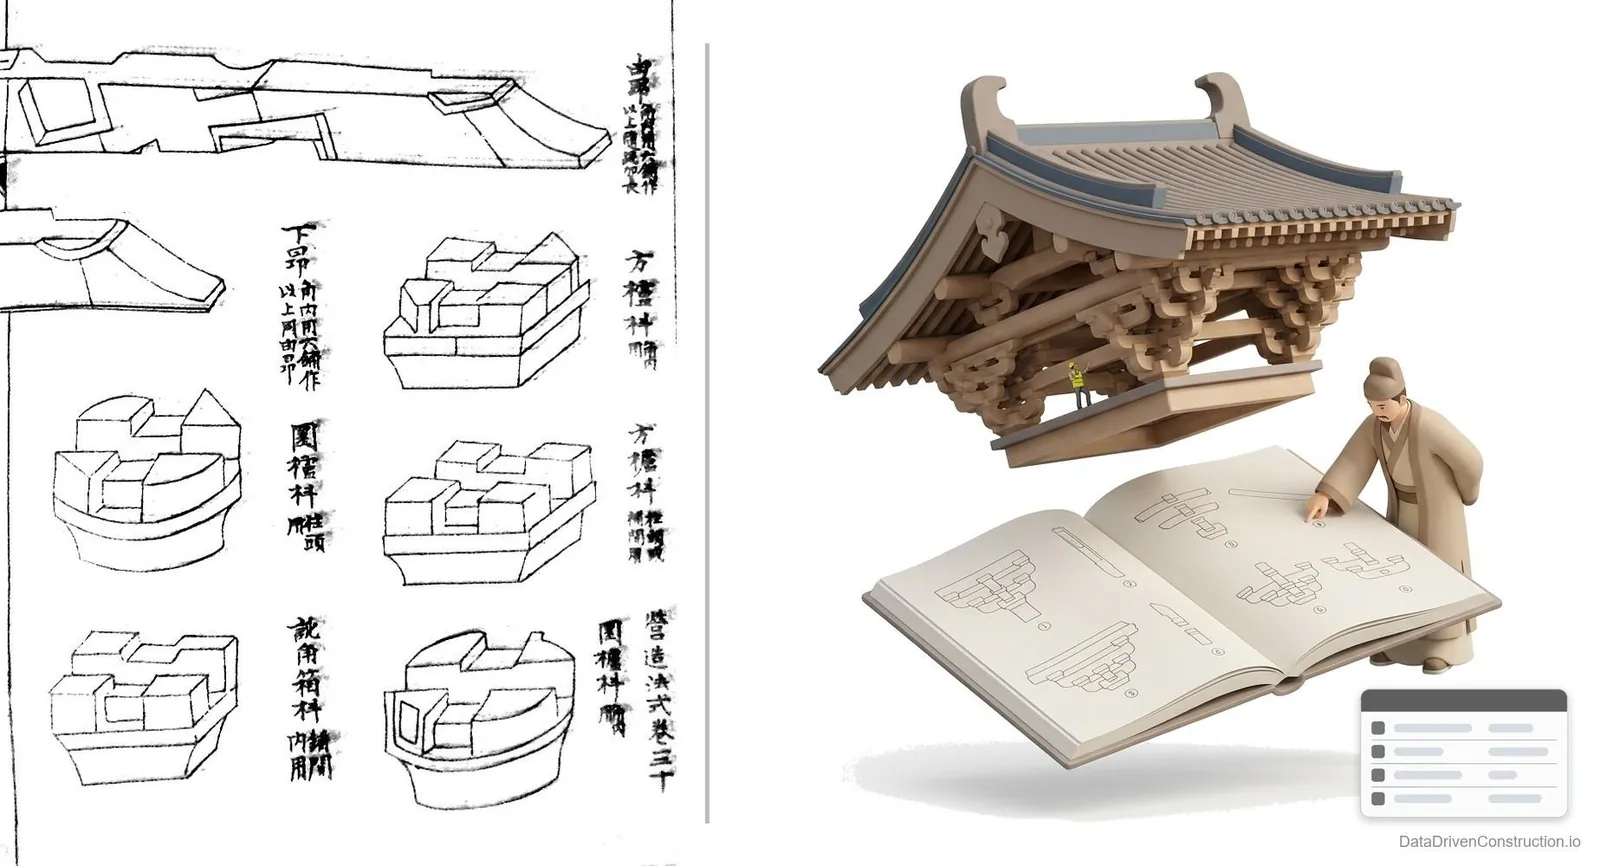
Three thousand years after the Sumerian tablets, the same problem is solved by the Chinese Song empire in 1103. By imperial decree, the treatise "Yingzao Fashi" (营造法式) is published - Li Jie's "State Building Standards" (Yingzao Fashi; Guo Qinghua, 1998). Of its 34 chapters, ten (chapters 16-25) are called 功限 (gōngxiàn), "labour norms": the time and cost of labour for making beams, columns and dougong brackets, assembling them and even transporting them. A separate section, 料例 (liàolì) (chapters 26-28), gives material-consumption norms (chinaknowledge.de).
Officially, the treatise was aimed at combating the padding of material figures and corruption on state construction sites. And the first version of 1091 was rejected and sent back for revision in 1097: its labour and material norms had proven too lax. In the eleventh century China did not merely have norms - it calibrated them.
In medieval Europe the same problem was handled by the masons' building lodges (German: Bauhütten), which guarded their masonry norms as a guild secret: the knowledge was not written down but passed within the lodge from master to apprentice - the same "economics in people's heads", only raised into a system. The history of work-rate setting is in large part the history of how this closed guild knowledge was, time and again, made open: the fifteenth-century printing press once did this to the guilds, and open norm data will do the same to today's closed reference books.
The modern European line of scientific work-rate setting begins in military engineering: before the Industrial Revolution, the largest "construction sites" were fortresses and canals. In 1688 the French army was among the first to face the need to count other people's labour honestly on a large scale. The French researcher François Gerber (in his work "De Vauban à Taylor", "From Vauban to Taylor") points to the 1688 regulation as foundational - rules for paying soldiers on royal earthworks that took the severity of the labour into account (Gerber F., De Vauban à Taylor). Marshal Sébastien de Vauban (Louis XIV's great fortification engineer, who built more than 150 fortresses) developed this approach: he broke work down into elementary operations, measured output and compiled tables in order to price labour fairly "both for the client and for the worker". His earthwork tables became the de facto first European compendium of unified norms and unit rates.

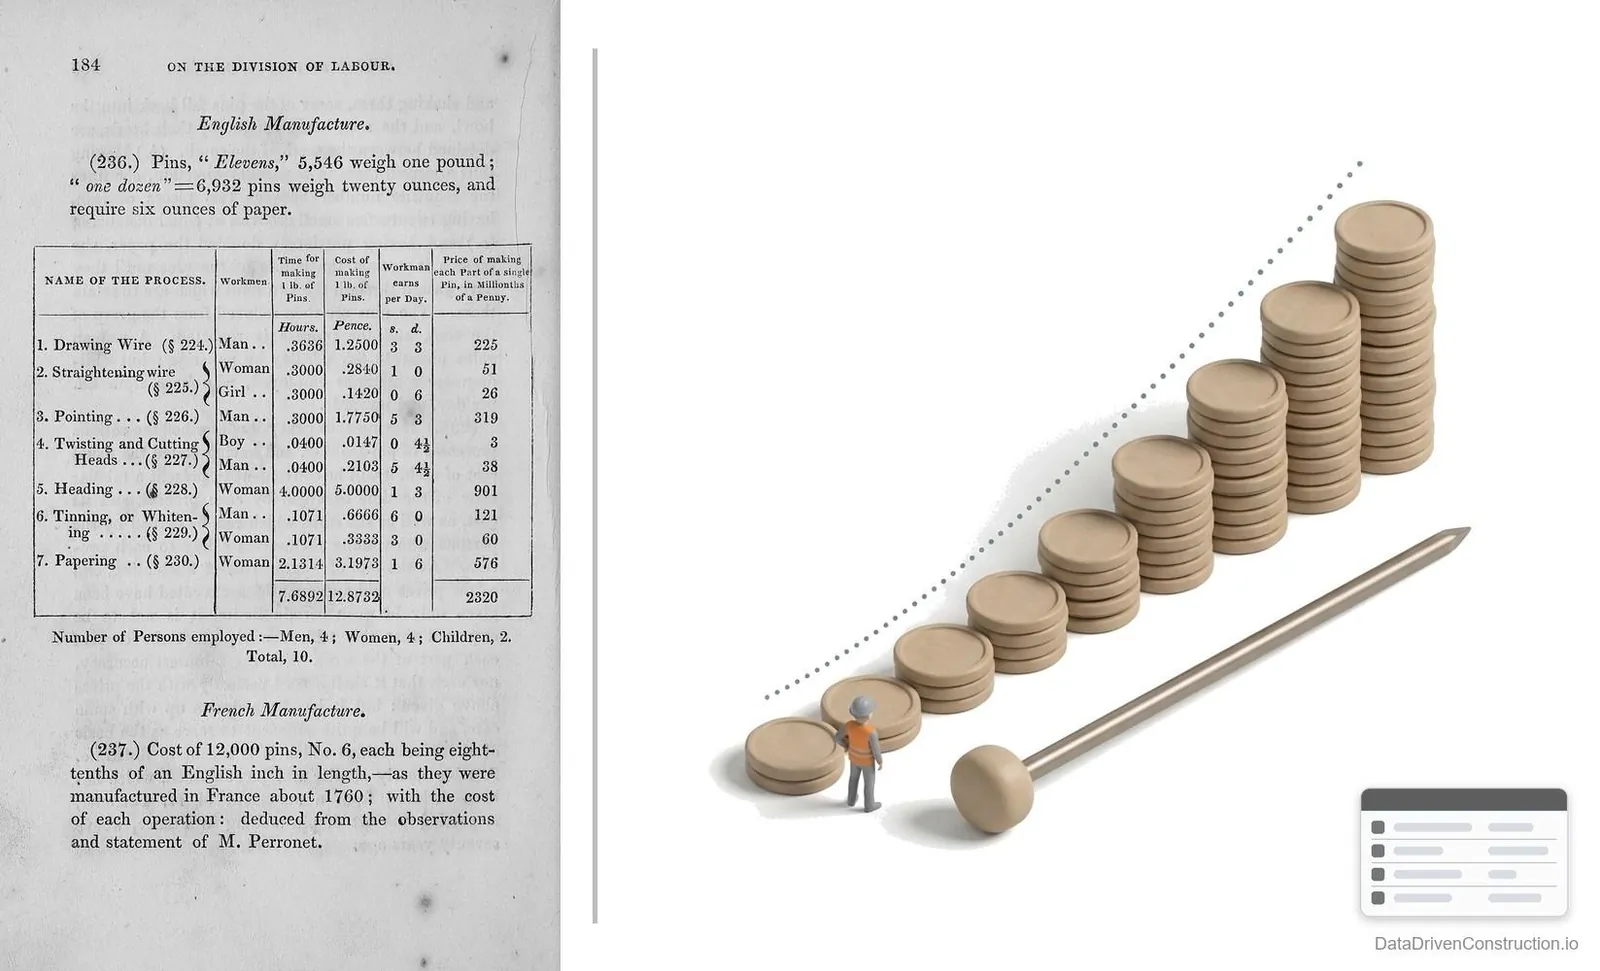
The next step is also French and also from construction: in 1760 in France, Jean-Rodolphe Perronet, the first director of the École des Ponts et Chaussées (the world's oldest civil-engineering school), was the first to time in detail, by the clock, how pins are made: he broke the work into separate operations and timed each one. This is one of the earliest documented time studies in history, cited today in textbooks on the scientific organization of labour as a starting point. And once again it was a builder who did it: the first time study was carried out by an engineer who built bridges over the Seine. More than half a century later, Charles Babbage (the father of the computing machine) repeated the measurements and published in On the Economy of Machinery and Manufactures (1832) tables of the cost of a pin broken down by operation - the first mass-printed resource costing.
In parallel, Russia builds the same system. In 1811-1812 the "urochnye reestry" (norms for the consumption of labour, materials and transport) appear, inheriting the regulation of state construction carried out through the Chancellery of Construction (Kantselyariya ot Stroeniy), founded in 1762. In 1832 (the year of Babbage's book) the first general compendium is issued, "Urochnoe polozhenie", the regulation for all works carried out on fortresses, civil buildings and hydraulic structures. After repeated revisions (tightened, as in China) the government approves the final edition in 1869. The fundamental difference from Vauban and Babbage: this is not one engineer's tables or one scholar's book, but a mandatory nationwide standard - for every state construction site in the empire, from fortresses to railways.
A Sumerian scribe, an Athenian treasurer, a Song official, a French marshal, an Enlightenment bridge-builder and Europe's military departments knew nothing of one another. Yet all arrived at one and the same resource data structure: work → operations → time norms → resources → money.
What unites these examples is not only the data structure but the role: everywhere, the norm was a tool of a strong centralized client (the state, the army, the planned economy) with which it controlled the party doing the work.
Alongside the evolution of cost-estimate calculation in the seventeenth to nineteenth centuries, the units of measurement themselves were being democratized in parallel. In pre-revolutionary France there were, by various estimates, up to a quarter of a million of them - and a "foot", a "cubit" or a "bushel" in two neighbouring villages could easily mean different quantities. And this was not harmless diversity but a working instrument of exploitation. Peasants paid their lord in grain "by the measure" - and the lord regularly adjusted that measure to suit himself. The word stayed the same, the quantity behind it changed, and catching the substitution was impossible. A classic divide et impera (divide and rule).
The metric system was not a technical reform but, precisely, a project of the French Revolution. Its motto, attributed to Condorcet, was "for all times, for all peoples". To introduce a unit that was common, public and reproducible meant depriving the stronger party of the ability to speculate on the very measure of things.
The resource norm is the metric system of construction work. And a market where the price of a metre cannot be broken down into atoms (or units) everyone understands - labour, materials and machinery - is pre-revolutionary France, where everyone has their own measure and no one can check it.
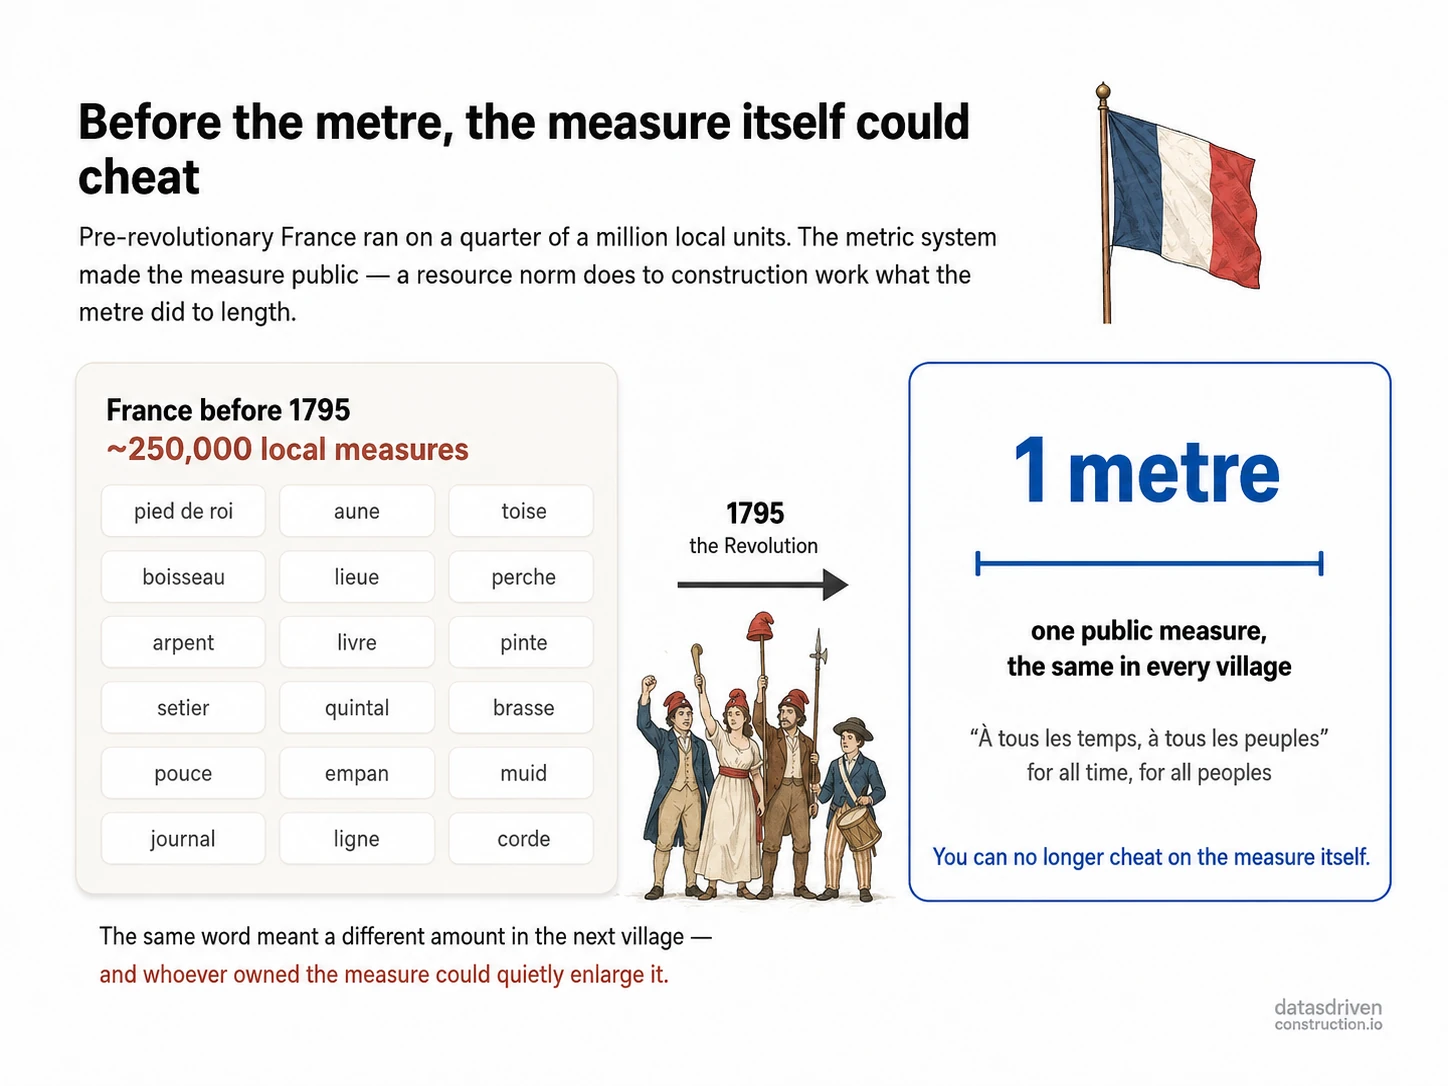
Future uberization platforms will inevitably rely on a single norm - most likely without any new revolution, one whose addressee is no longer the state but the client, and one that will hold not by command but by calculation.
If the theme of managing CAD databases (BIM since 2002) is reduced to the name of Charles Eastman and his 1974 whitepaper, then this many-thousand-year history of labour work-rate setting is collapsed into a single name: Frederick Taylor, the "father of scientific management". But Taylor did not invent this answer either. He turned someone else's answer into a product: a method, an instruction manual and an 1911 bestseller.
Taylor: the stopwatch, the shovel and the brick
Taylor's method grew out of four sources: the personal frustration of a foreman whose workers deliberately held down the pace under piecework (systematic soldiering); the engineering cult of the standard at Midvale Steel (where he worked), where parts were already being reduced to uniform dimensions; the late-nineteenth-century movement of engineers to make production management a discipline in its own right; and the intellectual line Perronet → Babbage discussed above.
Taylor's contribution lies not in inventing the time study but in the system: element → time norm → standard instruction → rate derived from the norm → planning through norms. Taylor was not the first to measure labour. He was the first to build a management system out of measurements, and to convince the world that it was a science.
What exactly he measured is best seen in two textbook experiments at the Bethlehem Steel works. The first was pig iron: a worker went from loading the previous 12.5 tons a day to 47, and was paid 60% more for it. The second was the "science of the shovel": Taylor experimentally established the optimal weight of a single scoop (about 9.7 kg, ≈21.5 lb) and introduced a dozen and a half different shovels for different materials - a small one for heavy ore, a large one for light ash. All of this was an answer to the low efficiency of hundreds of diggers who worked at half strength with identical shovels.
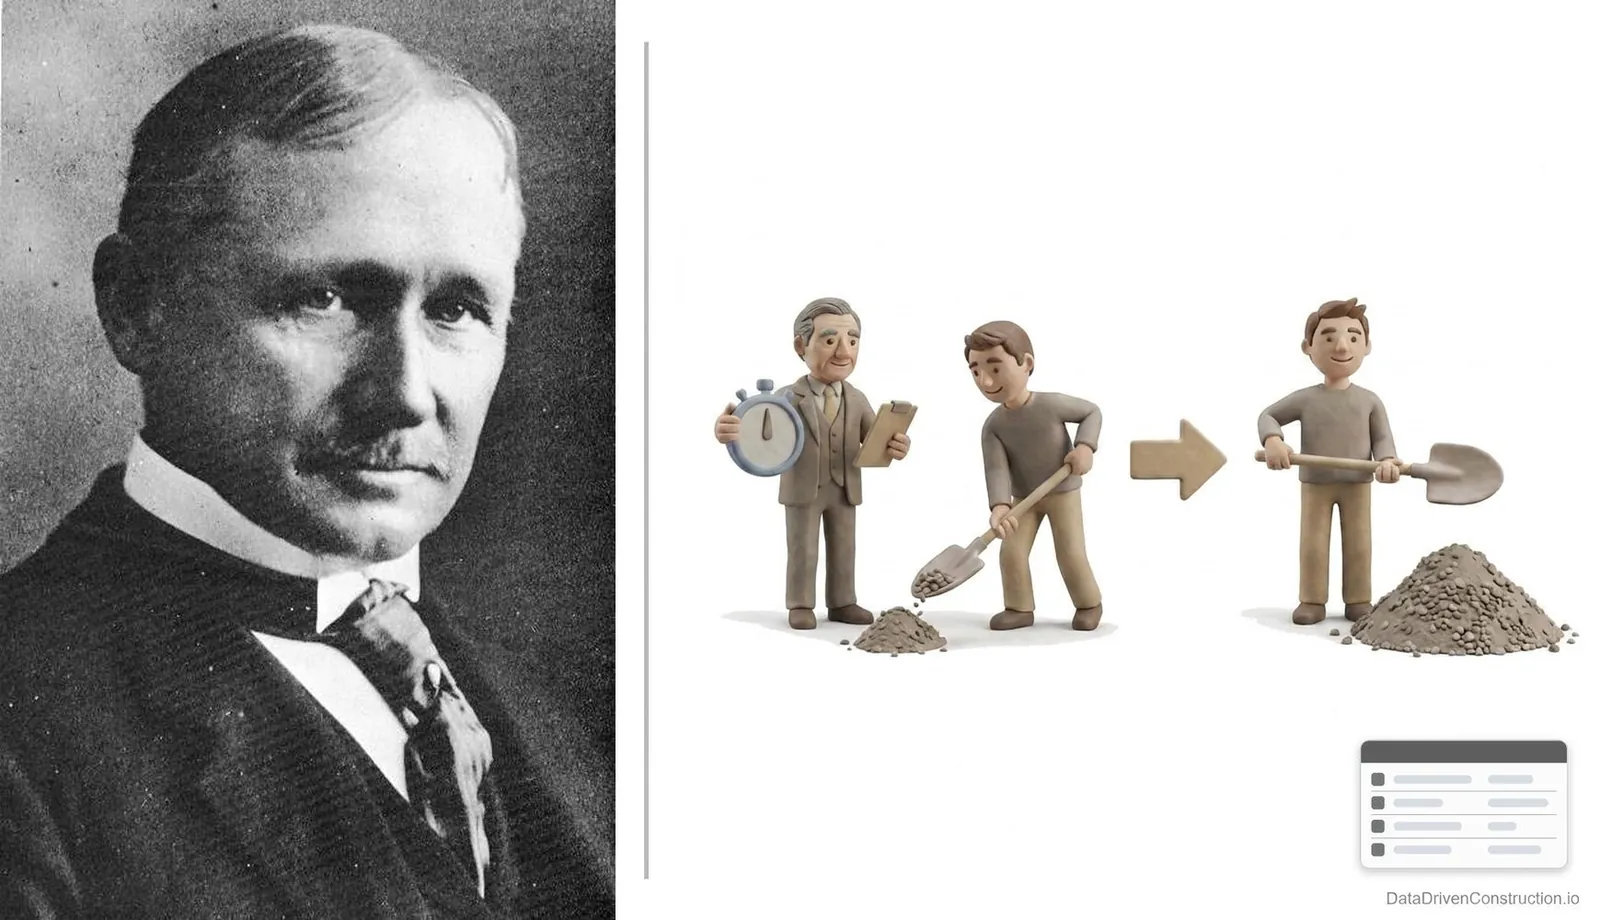
In 1911 The Principles of Scientific Management appears, with a thesis that today reads like a manifesto for the data-driven approach: "In the past the man has been first; in the future the system must be first".

Scientific management became a nationwide topic in America a year before the book - at the hearings of the Eastern Rate Case (1910-1911), where the railroads were demanding that the regulator raise their tariffs. The lawyer Louis Brandeis built his objection on an unexpected thesis: what the railroads needed was not new tariffs but scientific management and work-rate setting. His witness, the engineer Harrington Emerson, calculated that scientific management would save the railroads "a million dollars a day". The newspapers picked up the figure, the regulator refused the railroads their increase, and the term "scientific management", on Brandeis's cue, entered the national vocabulary. The invisible losses from inefficiency became, for the first time, a loud public topic across the whole country.
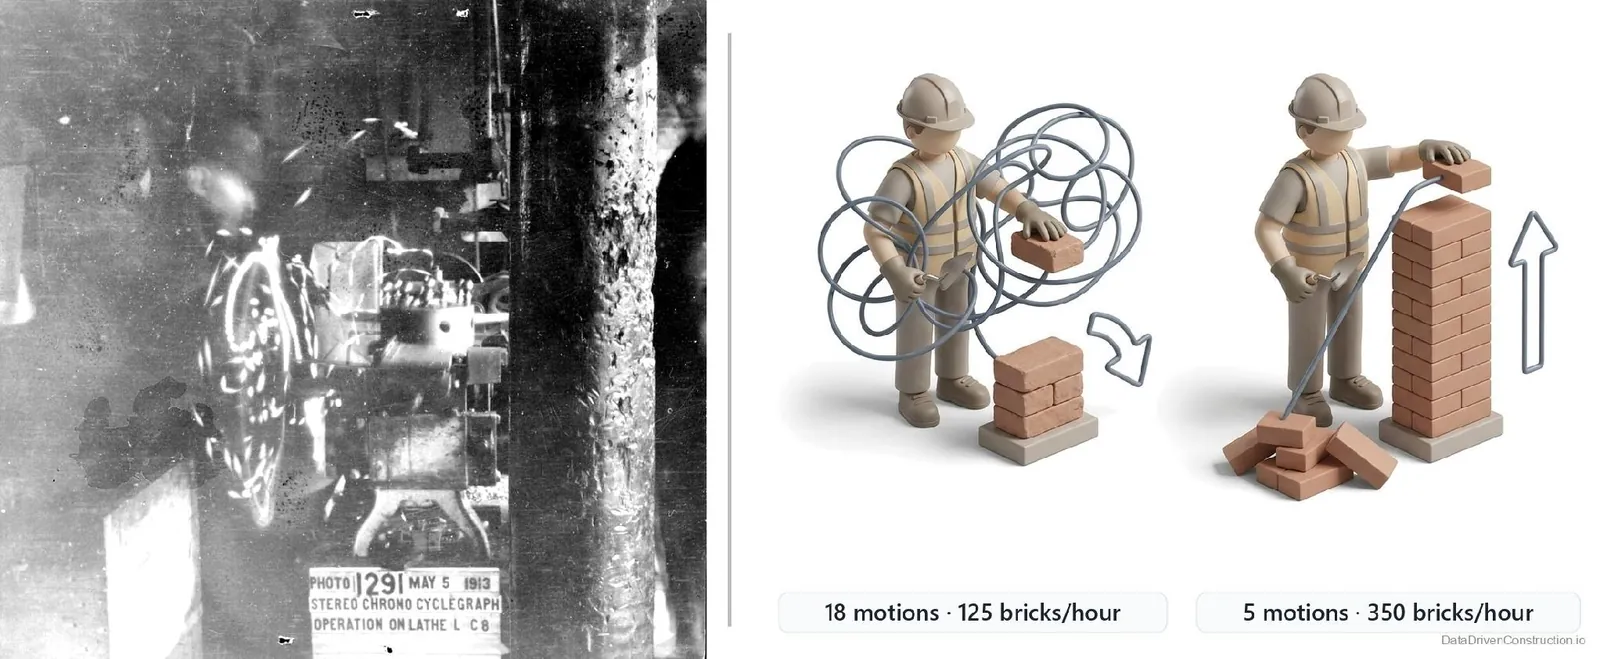
If Taylor measured time, then the husband-and-wife team of Frank and Lillian Gilbreth measured motion. Frank began as a bricklayer, rose to become a contractor, and his system of motion analysis cut the number of motions to lay a single brick from 18 to 5 and raised output from 125 to 350 bricks an hour (Gilbreth F., Bricklaying System, 1909). Not "work faster and sweat harder", but eliminate the superfluous: adjustable scaffolding so the bricklayer need not bend down for every brick, bricks fed the right way round, mortar of the right consistency. Three times as much from the same pair of hands.
The Gilbreths created a toolkit that today would be called motion capture: a microchronometer accurate to 1/2000 of a minute, frame-by-frame filming and chronocyclegraphy - lightbulbs were fixed to the worker's hands, and a long exposure drew the glowing trajectory of the motion. They also introduced the concept of the therblig (therblig - Gilbreth spelled backwards), eighteen elementary micro-motions from which any work is composed. These are the atoms of labour. And any construction norm is assembled from such atoms into a molecule.
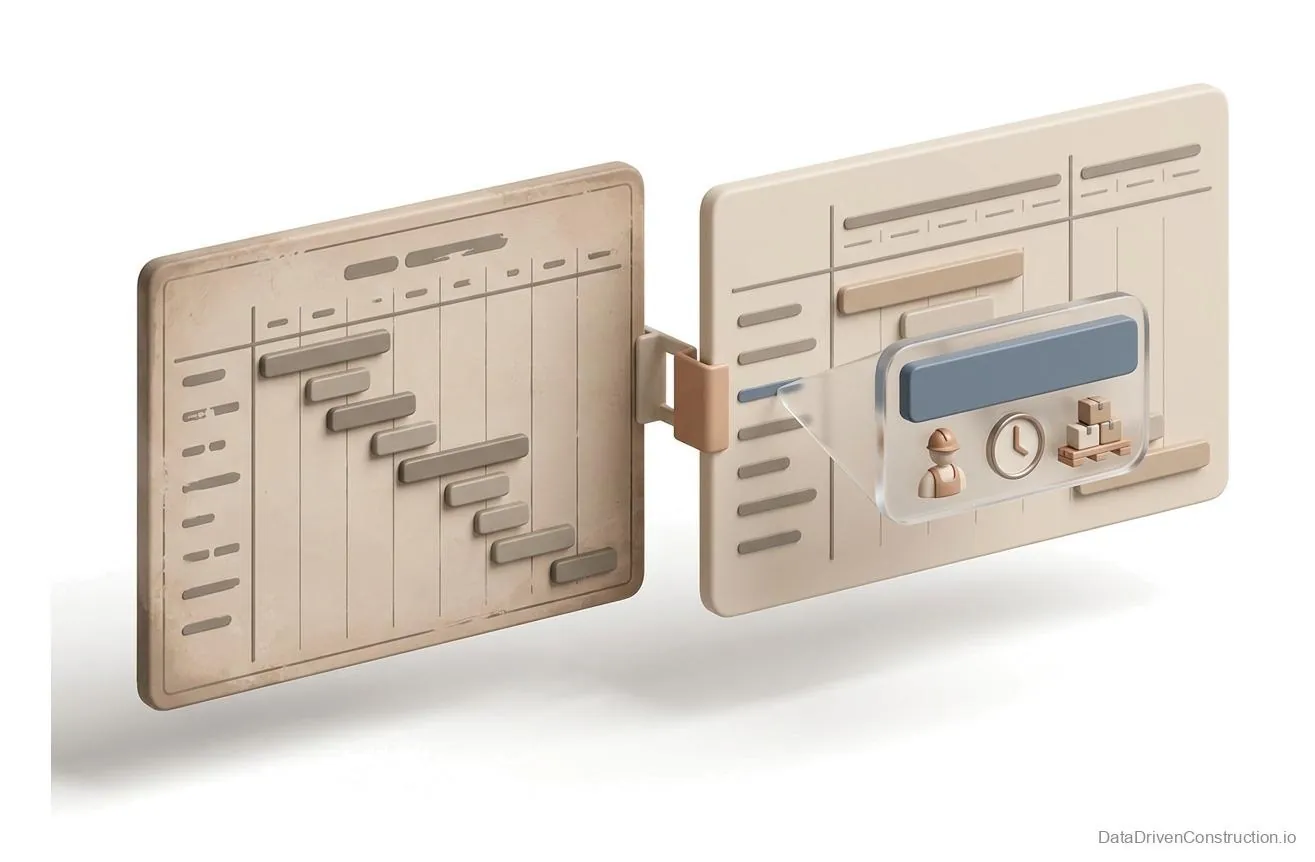
The third person in this circle is Henry Gantt, Taylor's colleague at Midvale and Bethlehem. The chart known to everyone who has ever opened MS Project we call by his name out of habit - even though a similar tool was created more than a decade before him by the Polish engineer Karol Adamiecki, who published his work in Polish and Russian.
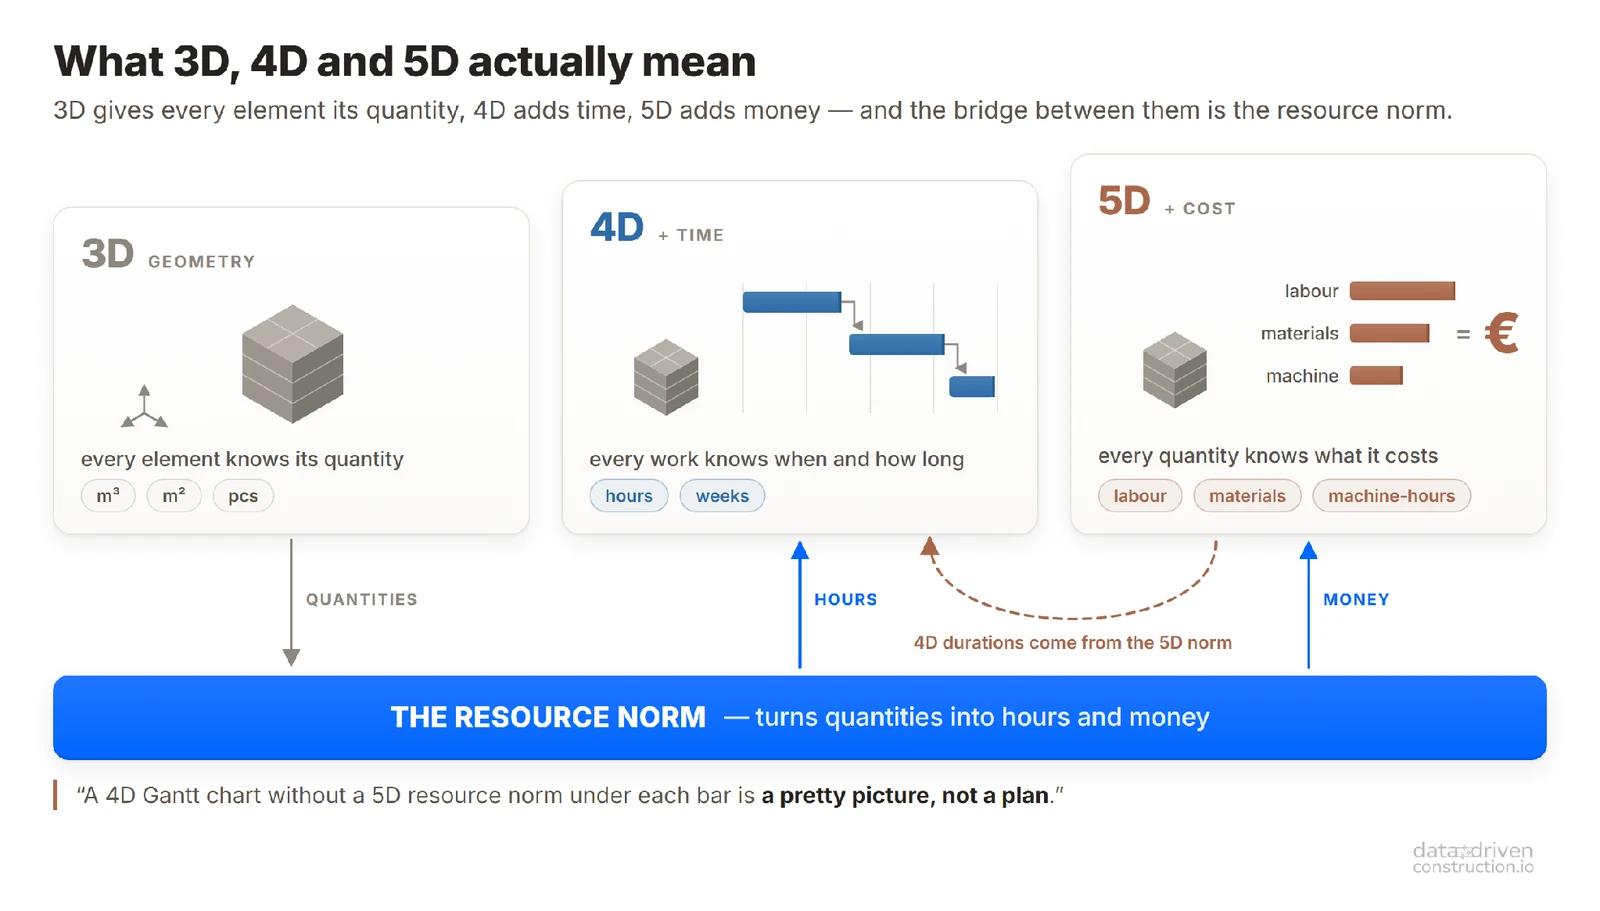
Taylor taught us to measure the work (5D), while Gantt and Adamiecki made time visible: when each task runs and what depends on what (4D). A bar on the chart is the same norm: "this work, with this crew composition, takes so long". Without a norm (5D) under each bar, the Gantt chart (4D) turns into rectangles drawn by eye. Which, in most companies, is exactly what it remains today.
Any 4D Gantt chart without a 5D resource norm describing the time resources under each bar is a pretty, often useless, picture - not a plan.
The scale of what Taylor and his circle achieved was best appreciated by Peter Drucker. He called the rise in the productivity of the manual worker the greatest management achievement of the twentieth century - over half a century, output per person grew several times over precisely thanks to work-rate setting and standardization.
In the West they took pride in this achievement. The country that went furthest of all in work-rate setting was the one that at first saw in Taylorism its worst enemy: Soviet Russia.
Lenin: from "sweat-squeezing" to state doctrine
In 1913-1914, the Bolshevik press ran articles by Lenin with telling titles: "A 'Scientific' System of Sweating" and "The Taylor System: Man's Enslavement by the Machine". For Lenin, Taylorism was the quintessence of capitalist exploitation. And he was branding Western time study in precisely the years when Russia itself had, for half a century, run a nationwide statutory work-rate code, the "Urochnoye Polozhenie": its own homegrown system of work-rate setting had operated across the whole country even before the revolution, yet was seen not as "science" but as the routine of official record-keeping.
Four years pass. The revolution has won, the economy lies in ruins, productivity is catastrophic. And in the spring of 1918, in his programmatic work "The Immediate Tasks of the Soviet Government", Lenin writes:
"The Taylor system, the last word of capitalism in this respect, like all capitalist progress, is a combination of the refined brutality of bourgeois exploitation and a number of the richest scientific achievements in the analysis of mechanical motions during work, the elimination of superfluous and awkward motions, the elaboration of the most correct methods of work, and the introduction of the best systems of accounting and control. The Soviet Republic must at all costs adopt all that is valuable in the achievements of science and technology in this field." - V. I. Lenin, "The Immediate Tasks of the Soviet Government", 1918.
This is an intellectual somersault: yesterday's "brutality" is declared mandatory to master, because inside the technology Lenin had discerned a system. Motion analysis, norms, accounting and control. Capitalism used them for the owner's profit; socialism, by design, for the common good. For the first time in history, the methodology of time study acquired the status of state policy for an entire country.
In the end, the very same Taylorist time study, born in American capitalism, leapt across into socialism, its direct opposite, and worked there no worse. Henry Ford pushed the same logic to its limit: in 1913 he put assembly on a moving conveyor, and the Model T's assembly time fell from roughly 12 hours to an hour and a half. Ford did not measure motions the way Gilbreth did; he re-engineered the flow so that the work itself came to the worker, paced to a fixed takt. One and the same idea took root with Ford and with Lenin alike.
Gastev and CIT: Taylorism as a state machine
The man who carried out Lenin's turn was Alexei Gastev: proletarian poet, trade-union leader, a metalworker with factory experience in France. In 1920 he founds the Central Institute of Labour (CIT), the world's first state research institute for work-rate setting and labour optimization. Around CIT grows the NOT movement, the "scientific organization of labour".
This movement was no single line. Alongside the laboratory-minded CIT ran the "Vremya" (Time) League, a mass movement for the saving of time, with cells across the country and Lenin among its honorary chairmen. How labour should be reckoned, through Gastev's narrow "laboratory" or through a mass public campaign, was something the schools debated all the way to open "platforms" at the Second NOT Conference in 1924. Soviet work-rate setting was born not by decree but from the competition of schools.
Western historiography calls Gastev the creator of a "Marxist variant of cybernetics" and a forerunner of ergonomics (Bailes K., Alexei Gastev and the Soviet Controversy over Taylorism, 1977). CIT's laboratories recorded cyclegrams of a hammer blow: the same glowing trajectories as the Gilbreths', only on the other side of the ocean. Gastev's memo "How to Work", with its 16 rules of labour, hung as a poster in workshops across the country. By the early 1930s, nearly two-thirds of Soviet industrial workers were paid by piece-rate, that is, against a norm, and by mid-decade more than 80%. In 1931 the first all-Union "Unified Output Norms" for building work also appear.
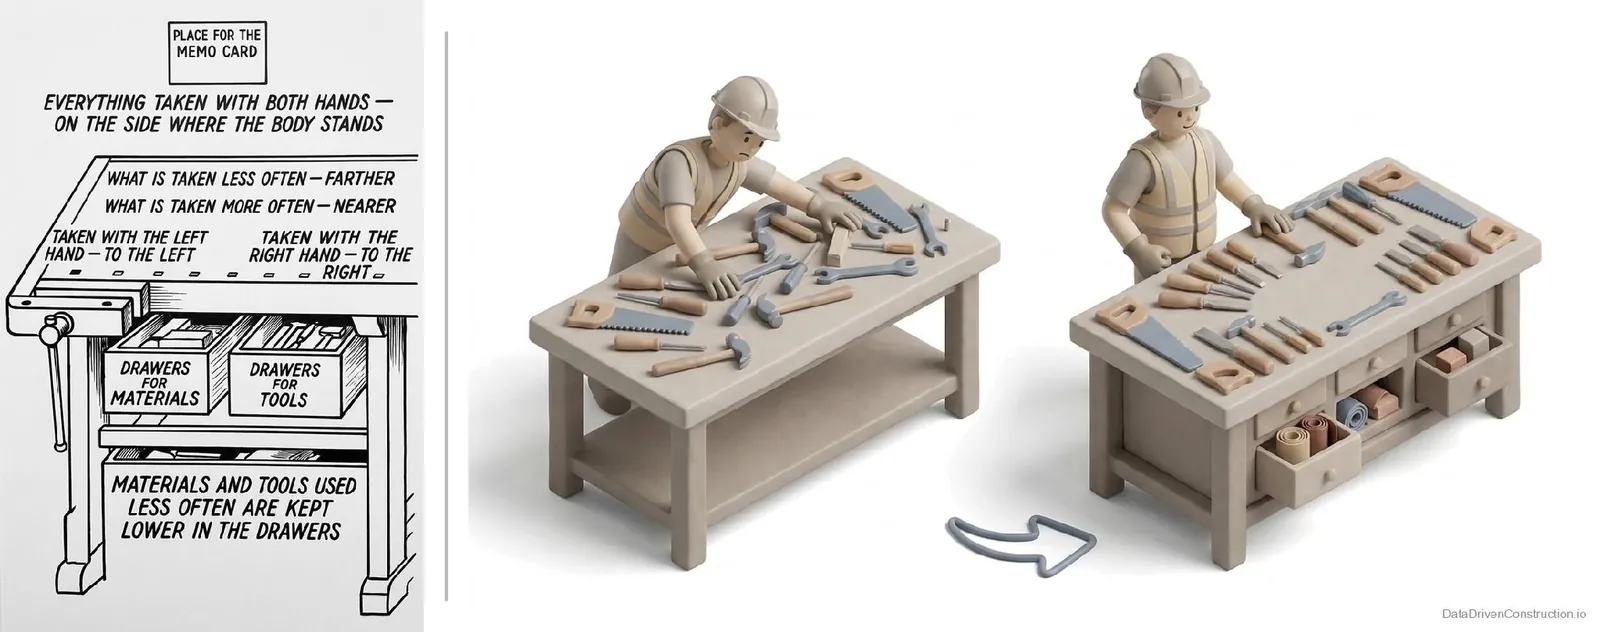
The methodology Gastev created outlived its creator and became institutionalized within the Gosstroy system. And so Taylor's stopwatch timing, in the hands of a poet-metalworker, turned into a state machine for work-rate setting.
ENiR: the operating system of the Soviet building site

This state machine of work-rate setting needed an operating system: a single body of rules for every building site in the country. That system was ENiR. ENiR, the "Unified Norms and Rates for construction, installation and repair-construction works", is not a single book but a whole library of dozens of volumes, covering practically all physical labour on the building site.
Open any norm and inside you will find: the work content (operation by operation), the crew composition (how many workers and of which skill grades), the time norm (man-hours per unit of measure), and the unit rate. From welding a trunk pipeline to fitting a door handle, everything is described in a single language of resources.
This data concentrates the experience of hundreds of thousands of construction specialists, gathered in standardized form since the mid-1930s.
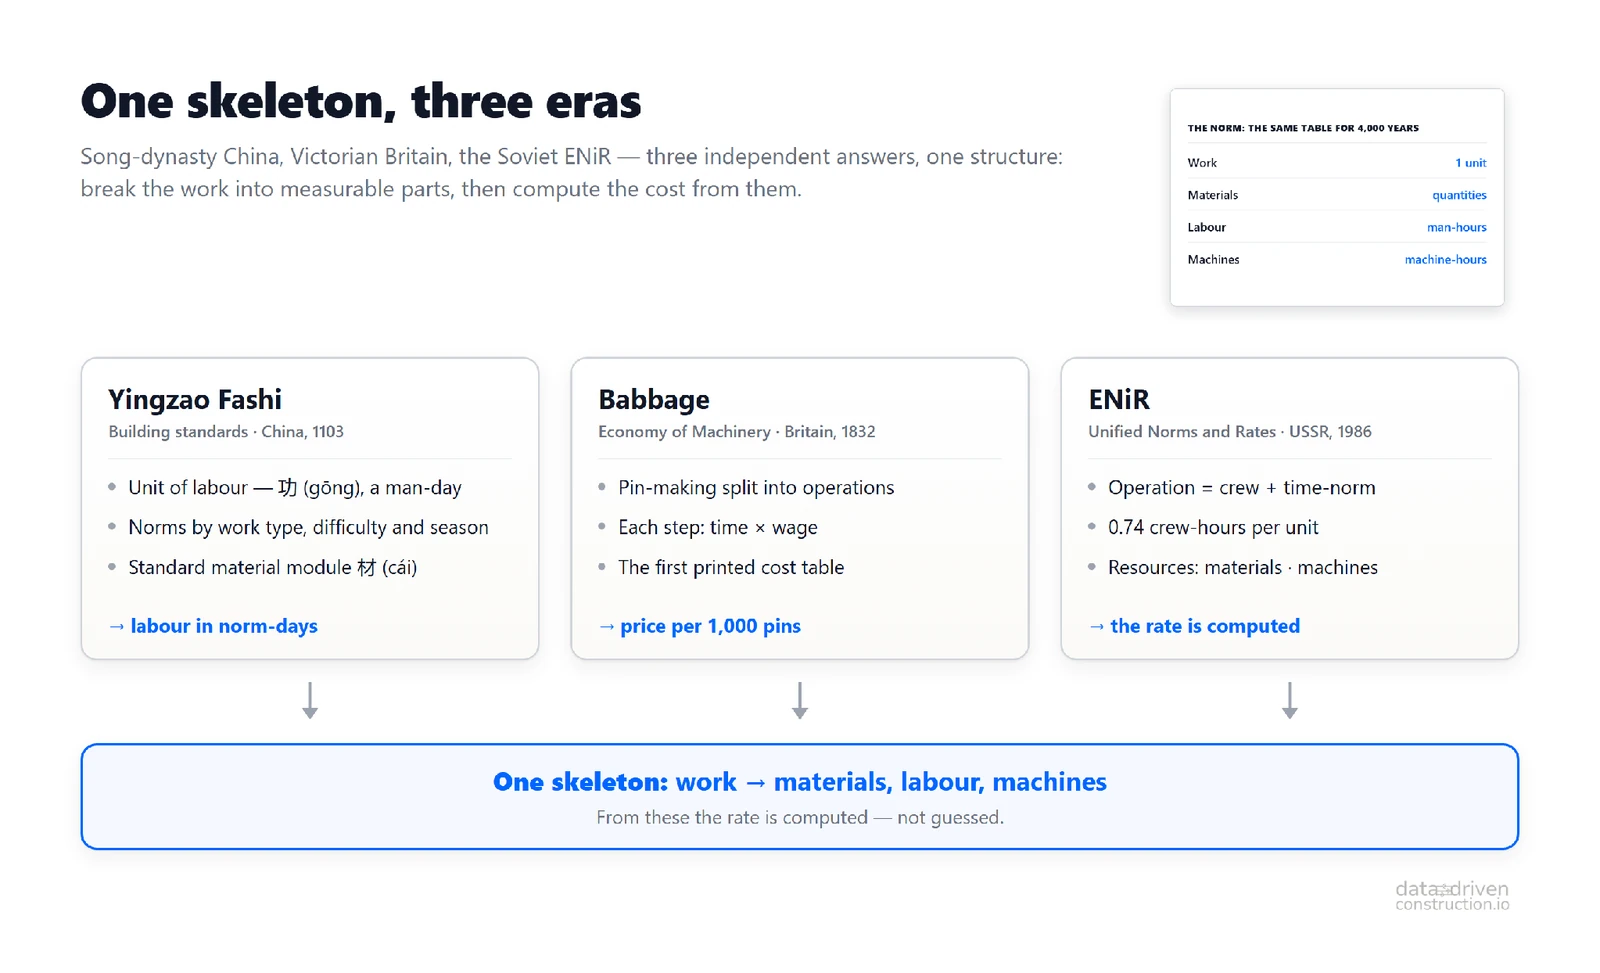
The system of norms describing construction work rests on three principles.
Dual legitimacy. Norms were approved not only by the state but also by the trade unions. The state demanded efficiency; the union guaranteed that the norm was achievable and the rate fair. A welder in one city worked to the same norm as a welder thousands of kilometres away (adjusted by regional coefficients). The norm became a common language that removed the foreman's arbitrary power.
Directive speed. If a more efficient welding technique is found, it enters the handbook and tomorrow becomes a mandatory standard for thousands of sites. In the West, those same best practices crawl for decades through trade secrecy and competition. But directive power has its flip side: an erroneous norm became mandatory just as instantly, and neither the worker nor the site manager could contest a standard handed down from above.
Predictability. Knowing the cost of installing a single panel from the handbook, an estimator with a calculator in hand could work out the cost of an entire new city. A city's cost estimate is assembled from norms in exactly the same way as a house's: out of the same resource atoms.
ENiR is the material artefact of an old argument: whether an economy can be calculated while bypassing the market. On the scale of a whole country, history lost that argument: total planning bred shortages and endless unfinished construction. Having failed as a way to manage the trillion-scale budget of an entire economy, a great union of a dozen countries, without serious computing power, calculation through the norm remains workable at the level of an individual site: with today's level of digitalization, predicting the resources and time of a single operation is entirely realistic.
The Soviet system of work-rate setting was described from the outside by the CIA: the documents are declassified and sit in the CIA FOIA electronic archive. February 1965, the declassified report "USSR Using New Method to Plan and Schedule Work on Construction Projects" (No. CIA-RDP79T01003A002200120001-3, CIA FOIA). The CIA examines the Soviet adoption of the critical path method (CPM):
At the chemical plant in Lisichansk, a network schedule of roughly 800 activities, computed on a mainframe, made it possible to build a urea-production factory in a year and a half instead of the two and a half "stipulated by Soviet construction norms". And the Chelyabinsk automatic blooming mill, according to the same report, was erected in a year rather than the usual two.
The USSR had a normative benchmark for the duration of any project: a reference point from which improvement could be measured. The gain could be measured at all only because there was something to compare against: the norm. The same report assesses the potential savings from mass adoption of unified norms and notes that the full effect will emerge only with further standardization of accounting methods. The CIA reached a conclusion: the gain comes not from the critical path method itself but from the norm beneath it, the benchmark against which the method is applied.

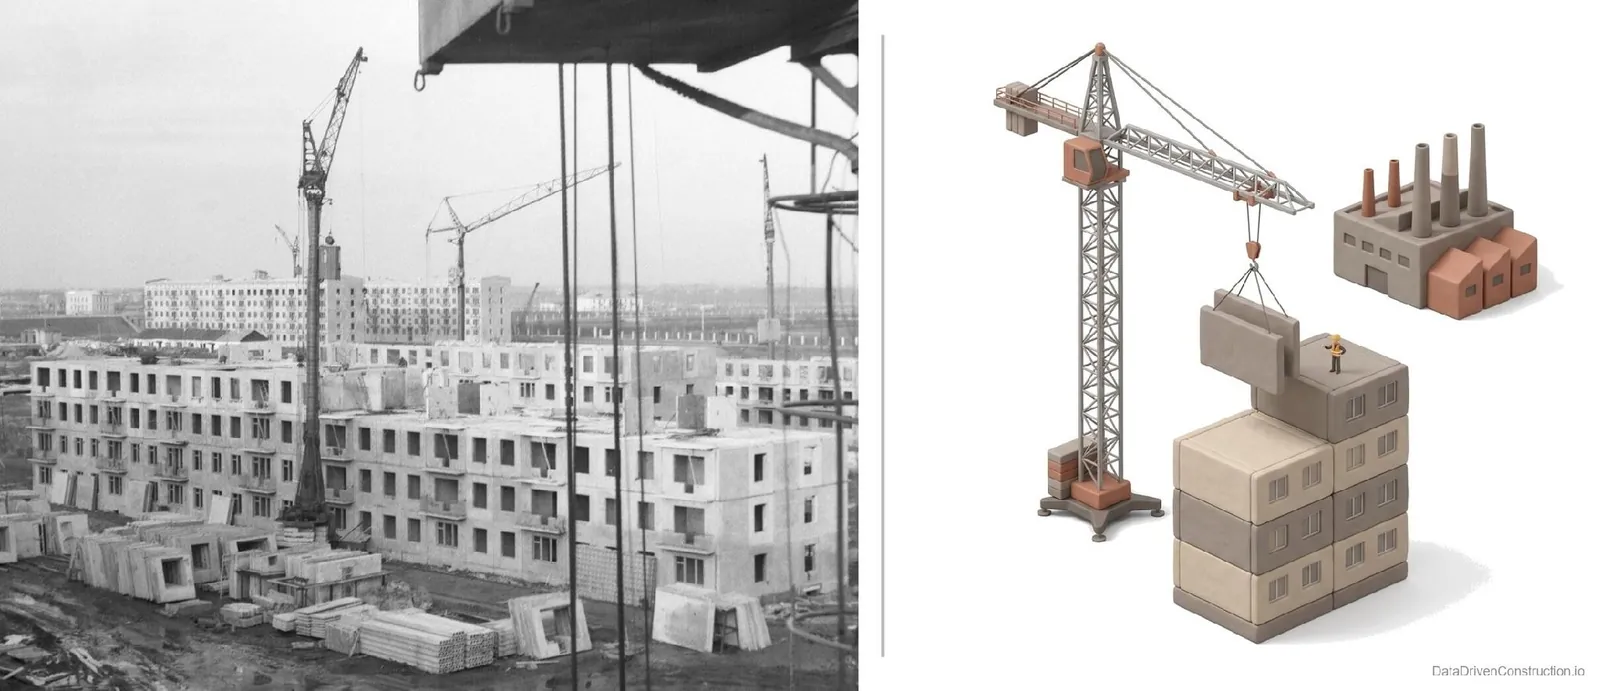
The CIA also tracked the scale. A 1957 report records two facts: since the mid-1950s, housing in the USSR could be built only to standard designs ("architectural excesses eliminated"), and the country's five-year development plan set a volume equal to half of all the urban housing the country had accumulated over its entire history. Four years later, CIA analysts explained how this was possible: a house had ceased to be a project and become a product. The panels are cast at a factory and merely assembled on site, and within five years this method was to grow fiftyfold, from just under three percent to 63% of all state housing.
The norm travels: from the USSR into China, Vietnam and dozens of countries
This system of unified norms and rates (ENiR) did not stay inside the USSR. In the 1950s came what economists at the US National Bureau of Economic Research NBER called "the largest technology transfer in human history" - Soviet aid to China under its 1st Five-Year Plan (1953-1957). At its core were the famous "156 Projects": steel mills, power plants, factories; in all, the Five-Year Plan comprised 694 large and medium-sized facilities (NBER WP 29455).
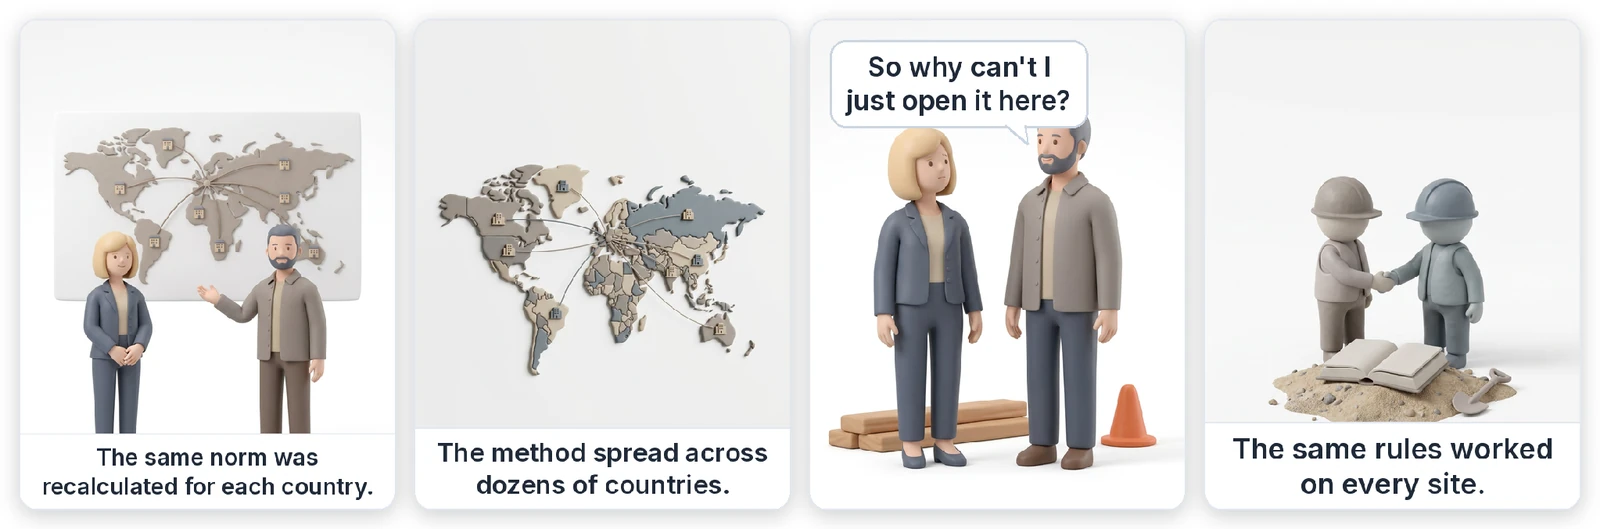
It wasn't only the hardware that was handed over - it was the methodology: thousands of Soviet specialists on the sites, tens of thousands of Chinese engineers in training, design institutes, standards, norms. On the main facilities the Soviet side carried out most of the design.
The cost-calculation system was transferred too. Chinese industry historians put it plainly: in the era of the planned economy the country "took over from the USSR and assimilated the system of estimate-and-budget norm-setting" (工程概预算制度), whose core was the uniformity, comprehensiveness and binding force of its norms. From 1953, on the advice of Soviet specialists, Chinese enterprises developed and applied norms (定额); the earliest cost-norm document is the "1954 Estimating Norms for the Design of Construction Works".
The result still works today: China's 定额 (dìng'é) system - state norm compendia under the aegis of the ministry MOHURD, where every job is described through its consumption of labour, materials and machine-shifts. Structurally it is ENiR speaking Chinese, and at once China's return to its own "Yingzao Fashi" of 1103 at a new turn of the spiral. Today, with China building more abroad than anyone in the world, its famous speed ("a hospital in 10 days") rests on something simple: to raise a building in 10 days, the duration of every operation must be known in advance.
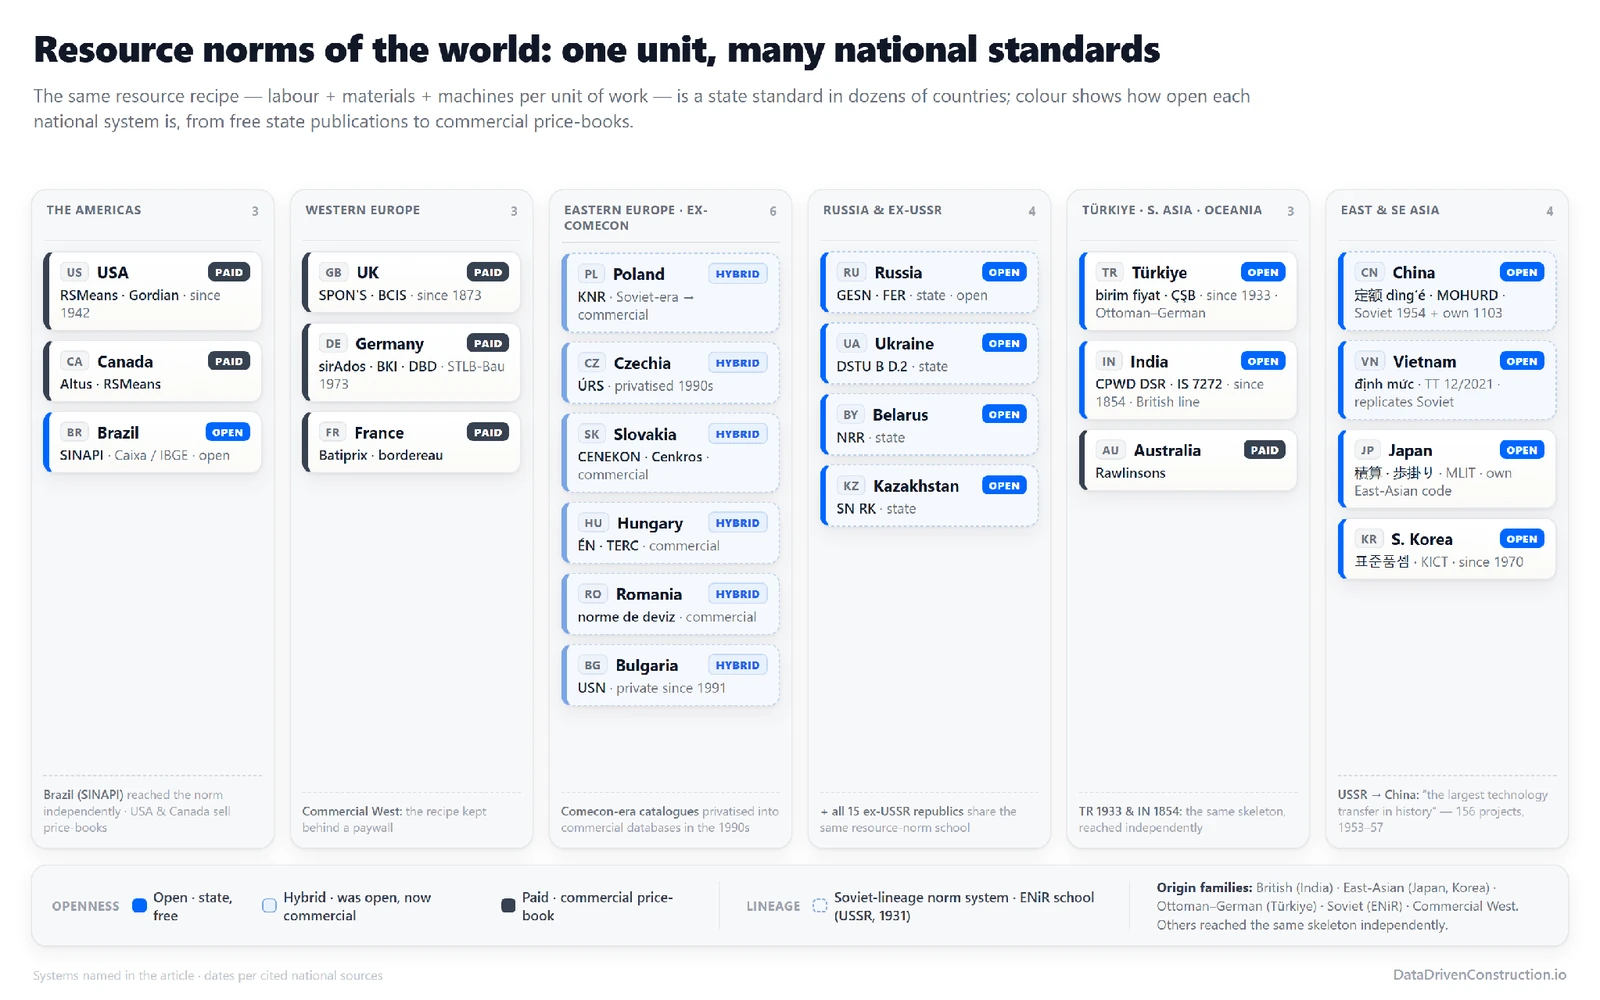
Vietnam is still developing its own version of ENiR: the current định mức xây dựng system is governed by Ministry of Construction Circular 12/2021/TT-BXD, and the academic literature openly calls Vietnamese cost estimating "a replication of the Soviet system" (N. Le, 2017). The structure is the same: material norms plus labour norms plus machine norms. A Vietnamese estimator in 2026 works in the same paradigm as a Soviet norm-setter in 1936 and an engineer of Taylor's circle in 1906.
Resource systems of the Soviet school operate in one form or another in all 15 former Soviet republics and are rooted in the countries of the former Comecon - Poland's KNR, the Czech ÚRS (which turned commercial after the 1990s). The transfer of the labour norm specifically, in man-hours, is firmly documented for China; for Vietnam the kinship shows in the structure. In transition economies a decades-tested base of labour inputs is more dependable than abstract market estimates - which is why the system lives on.
Turkey, India and East Asia: the same answer, different roots
The resource norm is not an ideology or anyone's national invention, but the thing that everyone who builds a great deal with public money arrives at independently. Turkey and India: both reached the same answer, out of the German-Ottoman and British engineering schools. Turkey's unit-rate compendia trace back to 1933 (YFK archive).
The kinship of the different methods shows best when you open one and the same job in different systems. Take concrete placement, a line item found everywhere. In the Turkish system the closest counterpart is item 15.150.1004 (ready-mix concrete C20/25 by concrete pump, delivered); in the Chinese, the 定额 compendium for cast-in-situ concrete (现浇混凝土). In the Russian GESN: 06-01-001-01, laying a concrete blinding from Collection 6 - lean concrete beneath foundations, placed by crane. The concrete class and the placement method differ across the three countries, which is why what matches here is neither the grade nor the hours but the calculation skeleton and the physics: about 1-1.02 m³ of concrete per cubic metre of structure. The same holds for any job: take a plasterboard partition or a tile finish, and across three independent references both the skeleton and the material consumption converge (about 2.1 m² of board per square metre of partition, about a square metre of tile and four kilograms of adhesive per square metre of finishing). All three line items, with their real codes, are gathered in a table (Fig. 30):
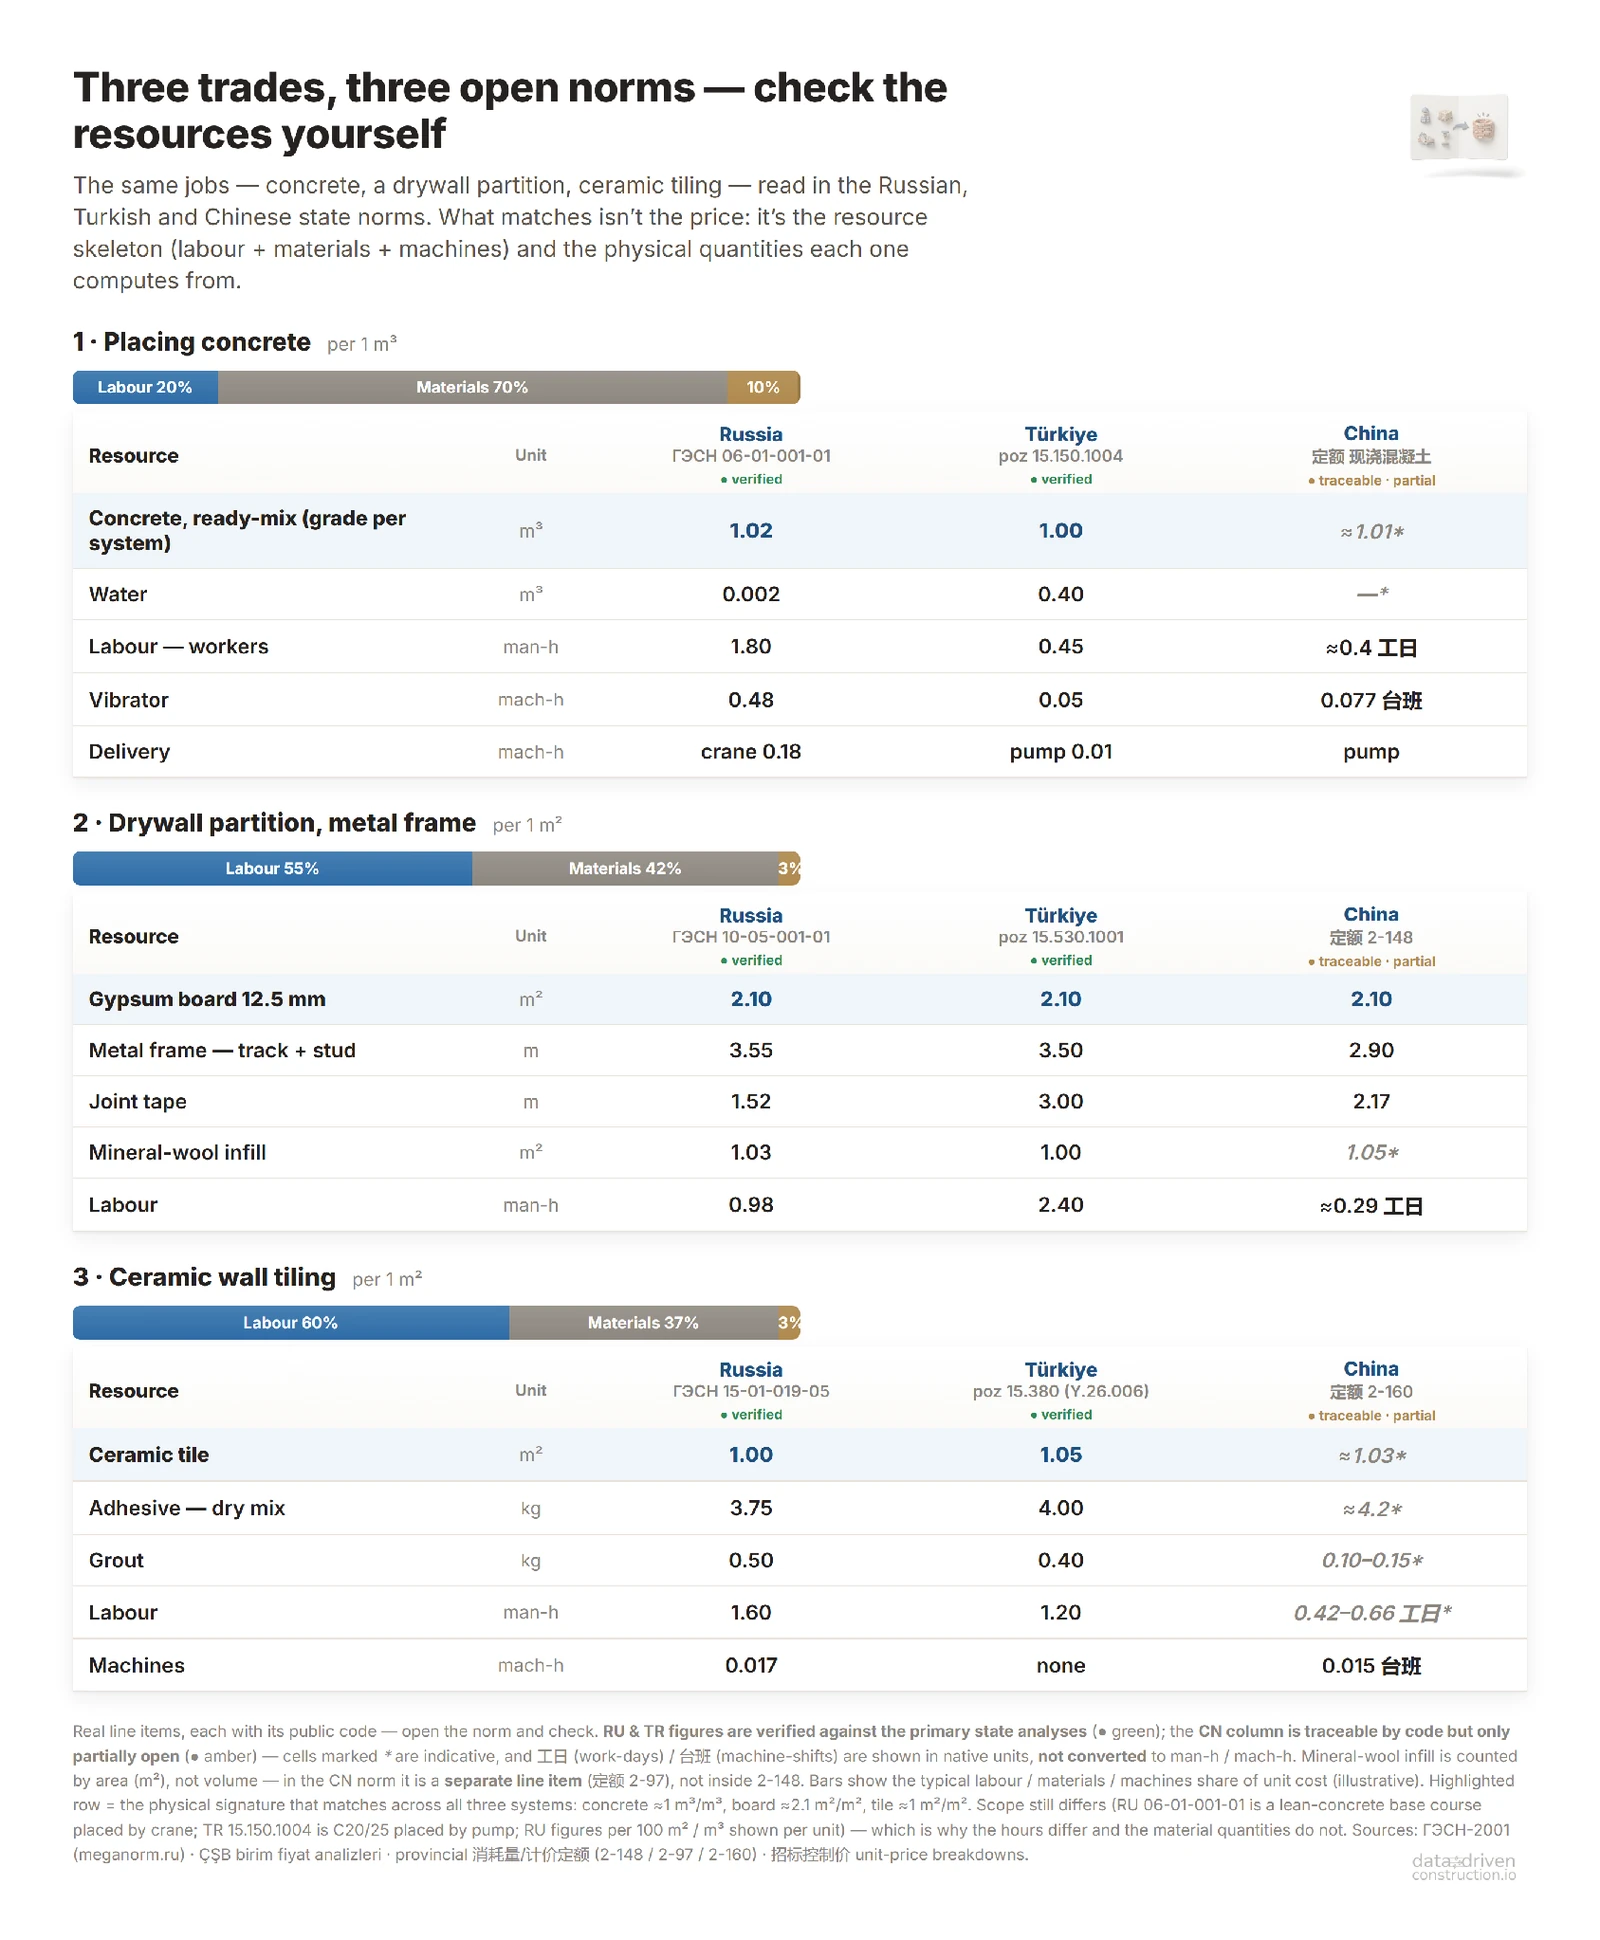
The skeleton is identical: labour in man-hours, machines in machine-hours, materials in physical units. The difference is in the "packaging". The Turkish one is single-stage: the analysis is converted straight into a market rate through rayiç - the resource market rates published by the ministry. The Soviet-Russian system is two-stage: first the consumption norm, then, separately, the price (market or indices). But in both the price is derived from resources. Money, though, proves little here: concrete is an exchange-traded commodity, and the similar turnkey prices per cubic metre in the two countries are driven by the world market for cement and rebar, not by the format of the estimate. And these analyses - in Turkey, China, Russia, Vietnam and India, unlike in many countries - lie in the open, like work scripts on Open Source principles.
Today Turkey's unified rates are issued by the responsible ministry through its High Technical Council (YFK). Each year two paired volumes come out - unit rates and price analyses that break every item (poz) into the same three groups: malzeme (materials), işçilik (labour), makine (machines). Both are freely available on the ministry's server; anyone can download the PDFs (yfk.csb.gov.tr).
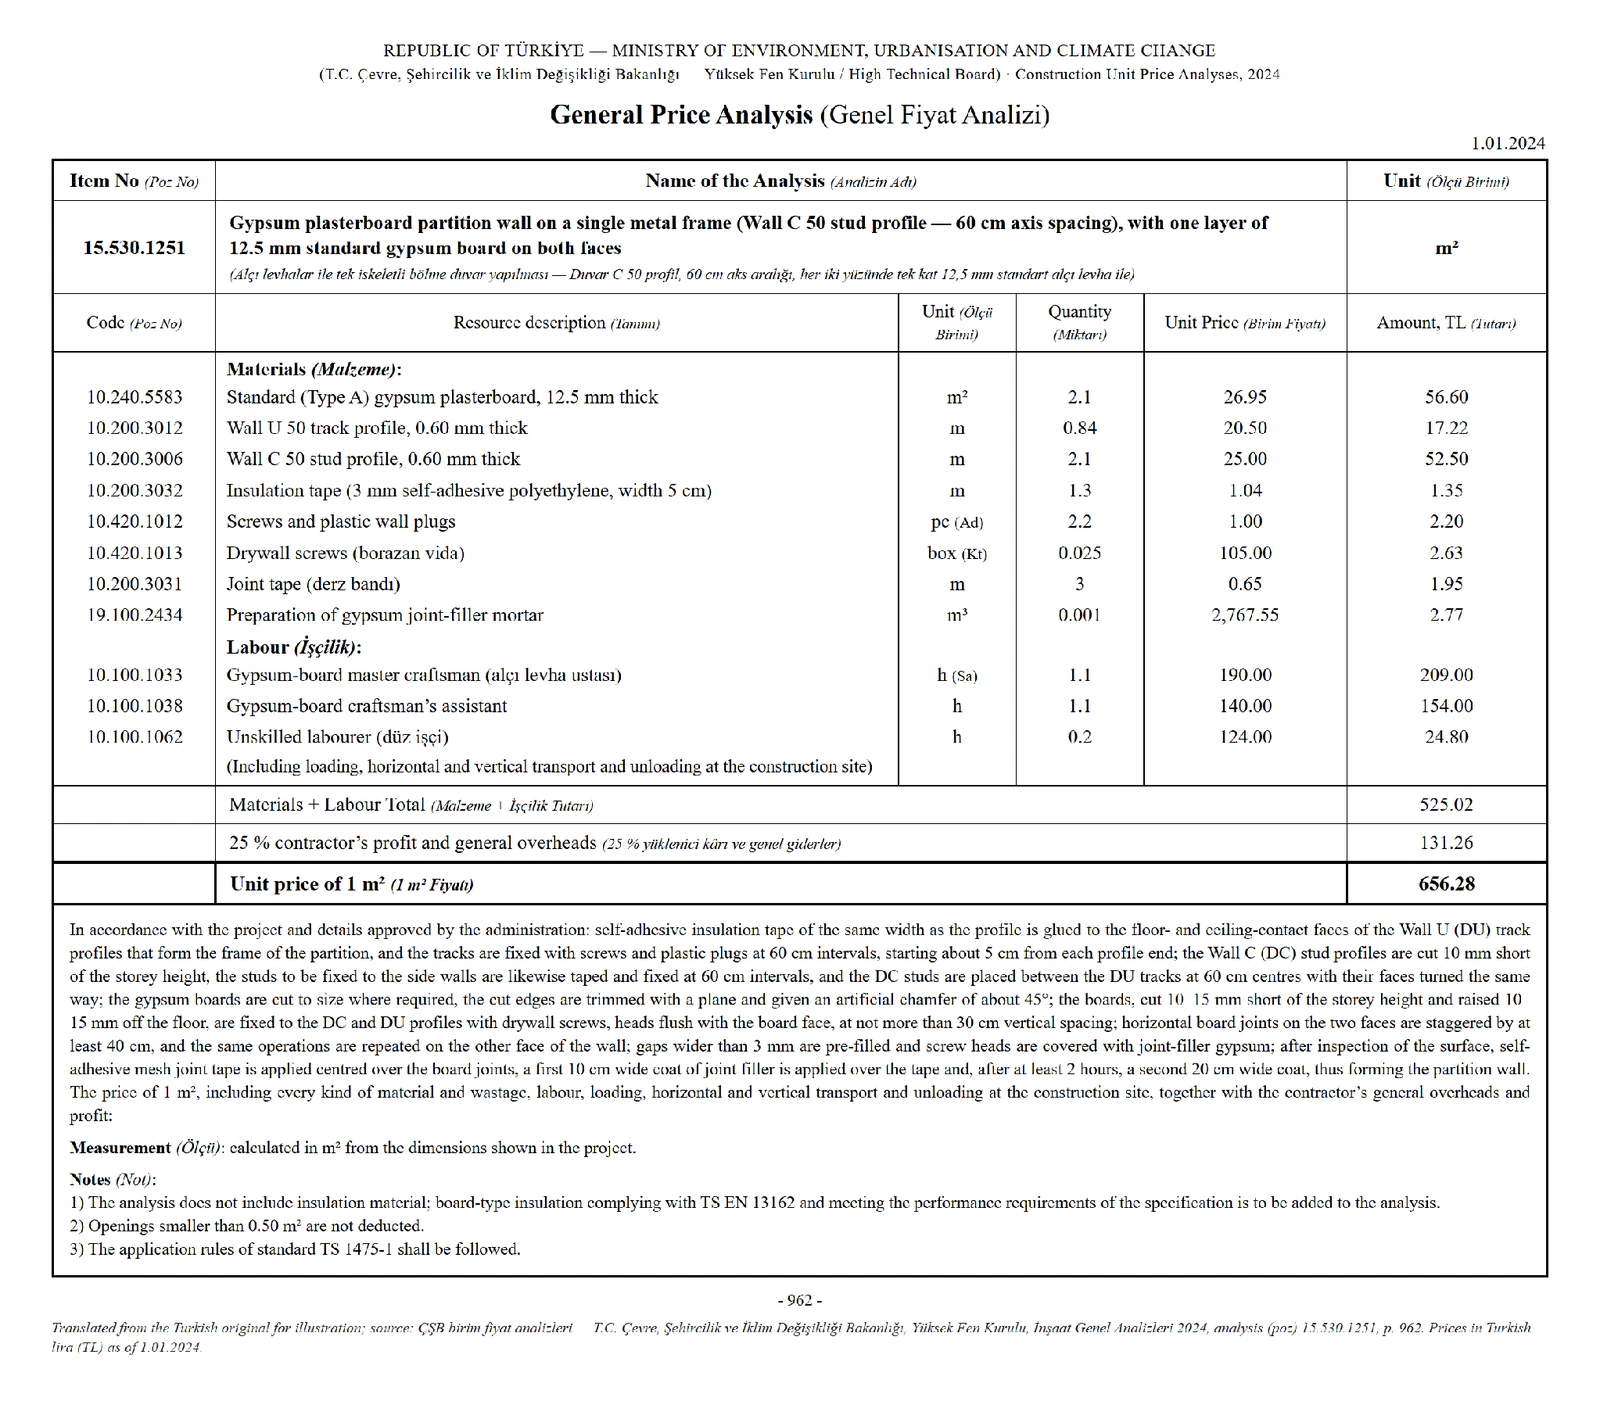
Turkey ranks among the world's construction heavyweights: in the ENR Top 250 it is consistently second only to China by number of international contractors (45 Turkish firms in the 2025 ranking, eight of them in the global top 100) (ENR, 2025). Behind that speed lies the same thing as behind China's "hospital in 10 days": norms.
India arrived at the same thing by a third route, through British standards. The Central Public Works Department has been costing roads, canals and barracks by operation since 1854 and issues two paired documents: the DSR (Delhi Schedule of Rates) - rates by item - and the paired "Analysis of Rates" - a breakdown of where each rate comes from: materials, labour, machines and overheads; labour norms are set out in a separate state standard, IS 7272. And, as in Turkey, all of it lies in the open: the volumes are posted as free PDFs on the department's website, and the state departments take them as a basis, multiplying by local coefficients.
East Asia arrived at the same thing on its own, without colonial schools. In Japan, cost estimating - 積算 (sekisan) - rests on the state norms 歩掛り (bugakari): coefficients for the consumption of labour, materials and machine-time per unit of work, which the infrastructure ministry MLIT revises each year and publishes openly. In South Korea, since 1970 a state body of norms has appeared annually - 표준품셈 (pyojun pumsem) - today maintained, on behalf of the ministry MOLIT, by the state institute KICT.
The degree of openness varies from place to place: in some the state norm is publicly available on Open Source principles, in others it is a paid commercial product.
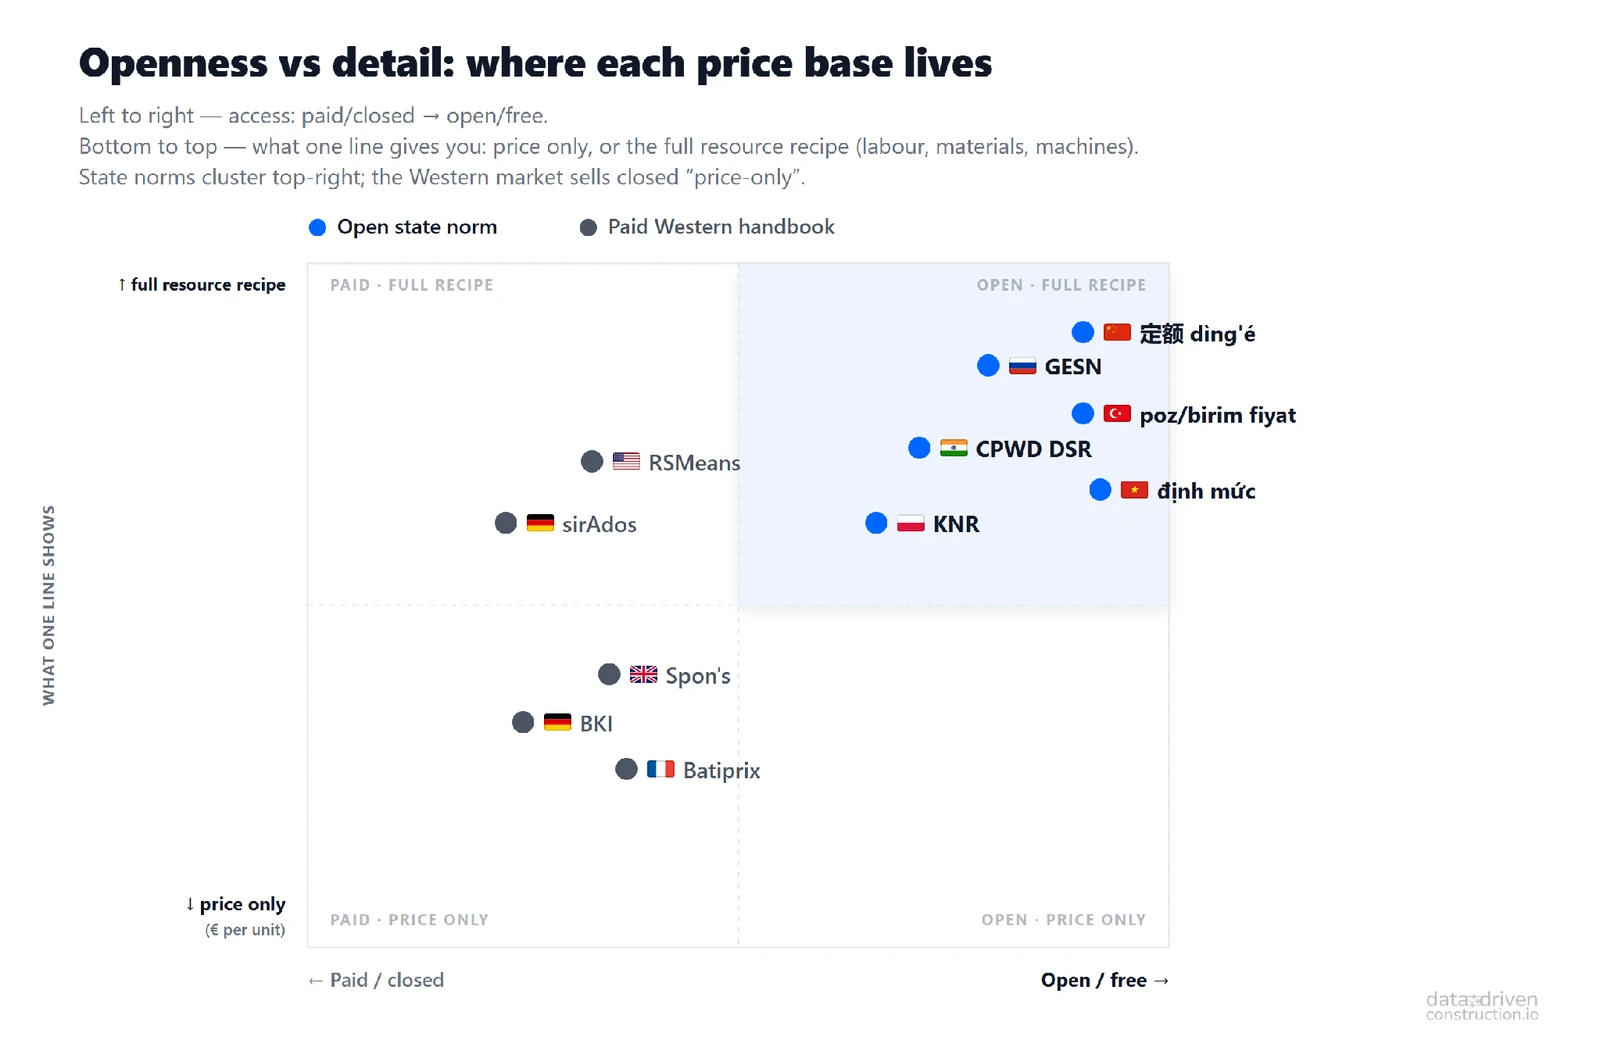
People arrive at one and the same resource norm by at least five unconnected routes: through the German-Ottoman school (Turkey), the Soviet centre (China, Vietnam), British engineering (India), home-grown East Asian codes (Japan, Korea) and Brazil's SINAPI. A unit that people who knew nothing of one another reach again and again is not someone's invention but a discovery - a law of nature for the industry. And almost everywhere, except in the Western market, this recipe turns out to be open.
The West sells the dish but keeps the recipe under lock and key
The West did not lose the recipe: it has detailed price books, and they do contain the resource breakdown. But it keeps that breakdown closed - behind a paid subscription, in proprietary formats, without a common open layer. The client is sold the finished "dish," while the "recipe" is left to premium subscribers. And yet even the most complete norm, on its own, does not give the "right price."
The Western path: the recipe exists, but it is locked away
The West took the market route and built detailed commercial price books. The logic is rational: the market values the speed of an estimate more highly than transparency about how it is put together. The question is what exactly these price books describe - and why the recipe is now beginning to be demanded back.
RSMeans (USA, now owned by Gordian) is North America's gold standard: 92,000+ items, thousands of ready-made assemblies, data on more than 970 locations, over 30,000 man-hours spent on data collection every year. BKI Baukosten (Germany, a centre run by the chambers of architects) offers statistical costs from completed projects, structured by DIN 276. SPON’S (UK, AECOM) holds around 20,000 prices. Batiprix (France), sirAdos and DBD/Baupreislexikon (Germany) are the equivalents in their own markets.
The model is older than any software. SPON’S has been published continuously since 1873 - the current edition is the 151st. The American Walker’s has run since 1915: the contractor Frank Walker compiled a reference book from the experience of his own building sites, and it has been reissued for more than a century (now in its 33rd edition). RSMeans began in 1942 with a book of unit rates for works, roughly a thousand items. This trade in norm compilations is a century and a half old.
From that same need for a common measure, an entire profession grew. The oldest known firm of quantity surveyors was working in Reading as far back as 1785; in 1868 the surveyors founded a professional institute, the future RICS, and in 1922 it published the Standard Method of Measurement - a standard method for measuring construction works, so that everyone would compute quantities the same way (replaced since 2013 by the New Rules of Measurement). The profession exists precisely because, without a single methodology for measuring work - as in pre-revolutionary France - a large build cannot be costed.

A typical line in such a book, seen through the eyes of a Taylorist engineer: "Plasterboard partition, m² - XX.XX €." This is the price of a dish on a restaurant menu. How many man-hours are inside it? What is the make-up of the crew? How much profile, board and screws does it consume? What output was taken as the norm? And since there is no recipe:
- you cannot verify the price (an unverifiable figure is the perfect breeding ground for the optimism bias from the start of this article);
- you cannot recalculate it when wages or material prices change - wait for the next paid edition;
- you cannot optimize the work - you can't improve what hasn't been broken down into operations;
- and most important of all - you accumulate no knowledge: every project passes by without leaving the company any resource statistics.
The Western books do have a resource breakdown, but for extra money. SPON’S publishes labour constants and calculation build-ups, sirAdos gives a Lohn/Gerät/Material breakdown and Zeitwerte (time norms), Baupreislexikon details material consumption, and RSMeans splits the price into material/labor/equipment. The recipes are there, but you have to pay extra for them: an annual subscription to RSMeans Data Online runs from $396 for basic access to almost $6,000 for the full version, while the prices of the printed RSMeans, BKI Baukosten, SPON’S and sirAdos are gathered together in Fig. 33. The resource breakdown, as a rule, lives in the upper, premium tiers; the basic subscription more often hands over only the "price of the dish."
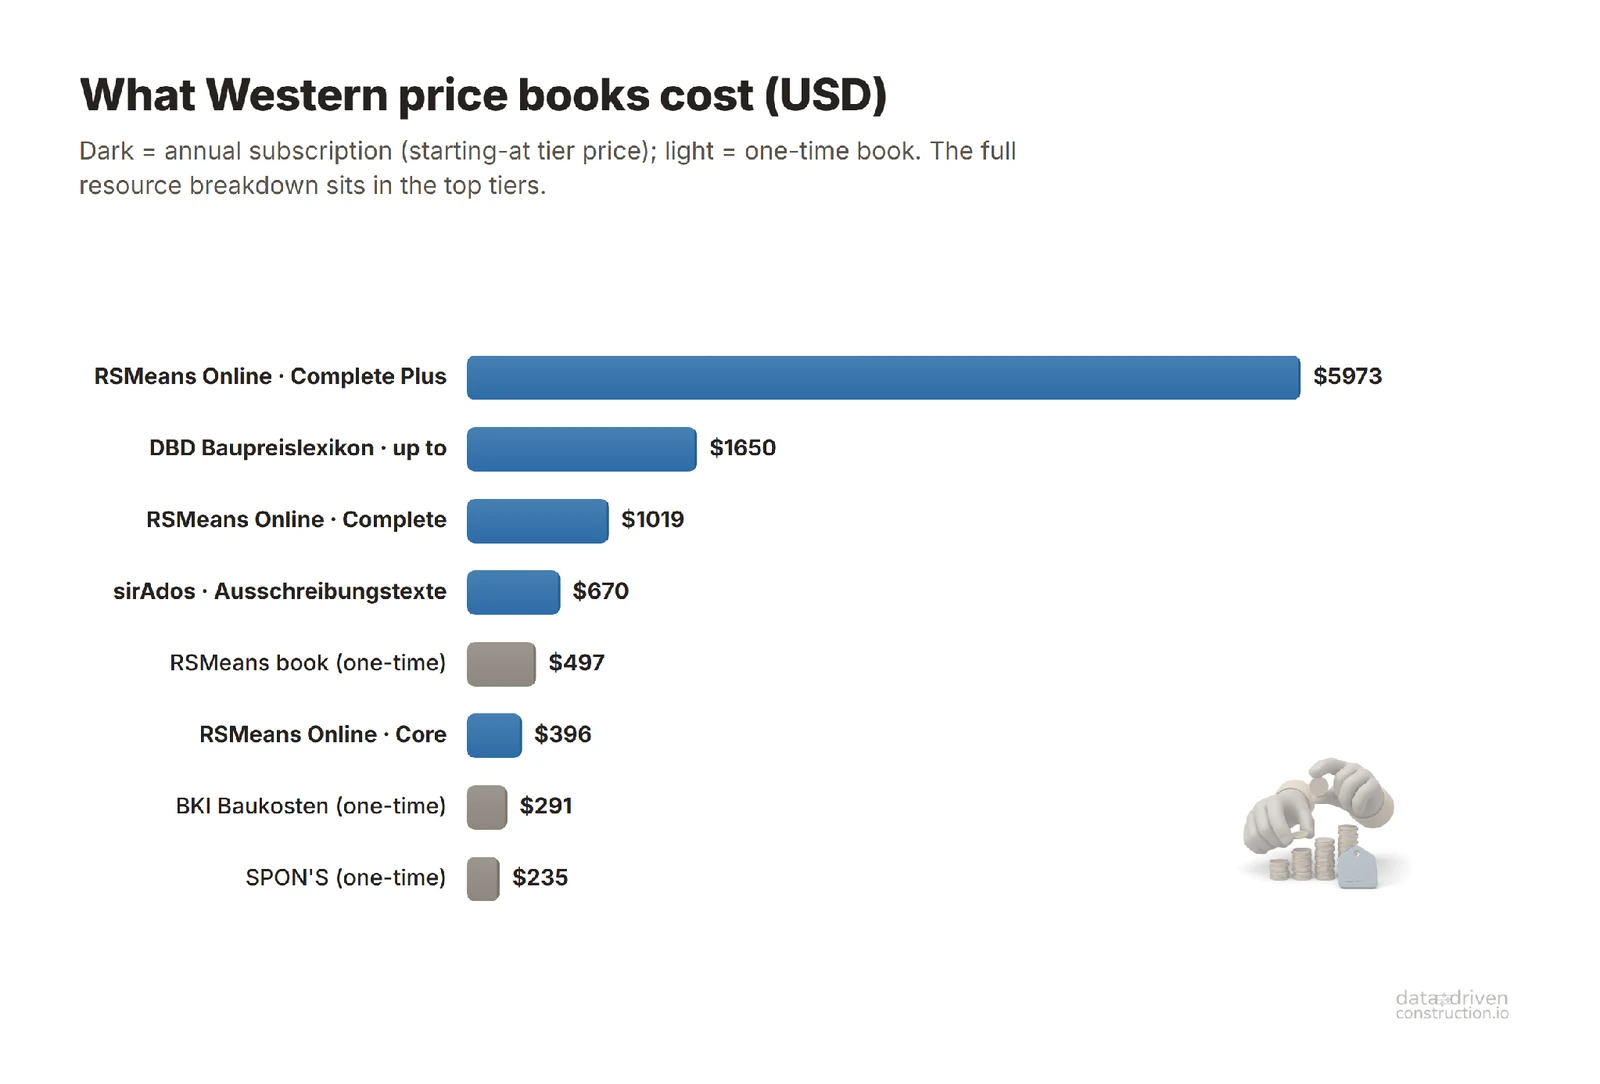
Germany has more than just price lists: it also has STLB-Bau (Standardleistungsbuch für das Bauwesen) - a single standard for describing works, introduced in 1973 so that the order, the tender and the contract would all speak about the same work in the same language. But this is precisely a language of description, not an open resource-and-time model of an operation - with its crew make-up, its machinery, its conditions and its feedback from the site. The French have their own, similar culture (bordereaux, prix unitaires). On the whole, Western systems solve commercial, fast estimation and standard description well, but they do not create a common open layer - a model of the work itself.
In the Western model, resource information is fragmentary, locked away in proprietary formats and paid subscriptions, and does not form a single open language for the industry.
In the Asian and Soviet school, price is derived from the norm; the Western model turned this around: first the price, and the resource breakdown as an add-on for premium subscribers.
This model of charging for reference books had, in the early twentieth century, its own "innovator" who pushed it to the limit. Selling measurement as a closed service began half a century before digital price subscriptions. In the 1920s and 1930s the consulting engineer Charles Bedaux sold enterprises his own unit of labour - the "B": a fraction of a minute of work plus a proportional fraction of rest; the norm was 60 B per hour, with a bonus for beating it. By the mid-1930s about a thousand enterprises in a couple of dozen countries were running on the Bedaux system - DuPont, Kodak, Fiat, ICI, General Electric. The methodology, however, belonged not to the client but to the firm - contemporaries called the calculation method itself a "closely guarded secret": the system could not be bought like a book, only together with Bedaux's consultants. Workers refused to live by a Bedaux norm they were not allowed to see: a wave of strikes swept through, American textile workers called the system "even worse than the old Taylor one, with a stopwatch", and the British Trades Union Congress concluded that it was simply impossible to compute such a unit of labour scientifically.
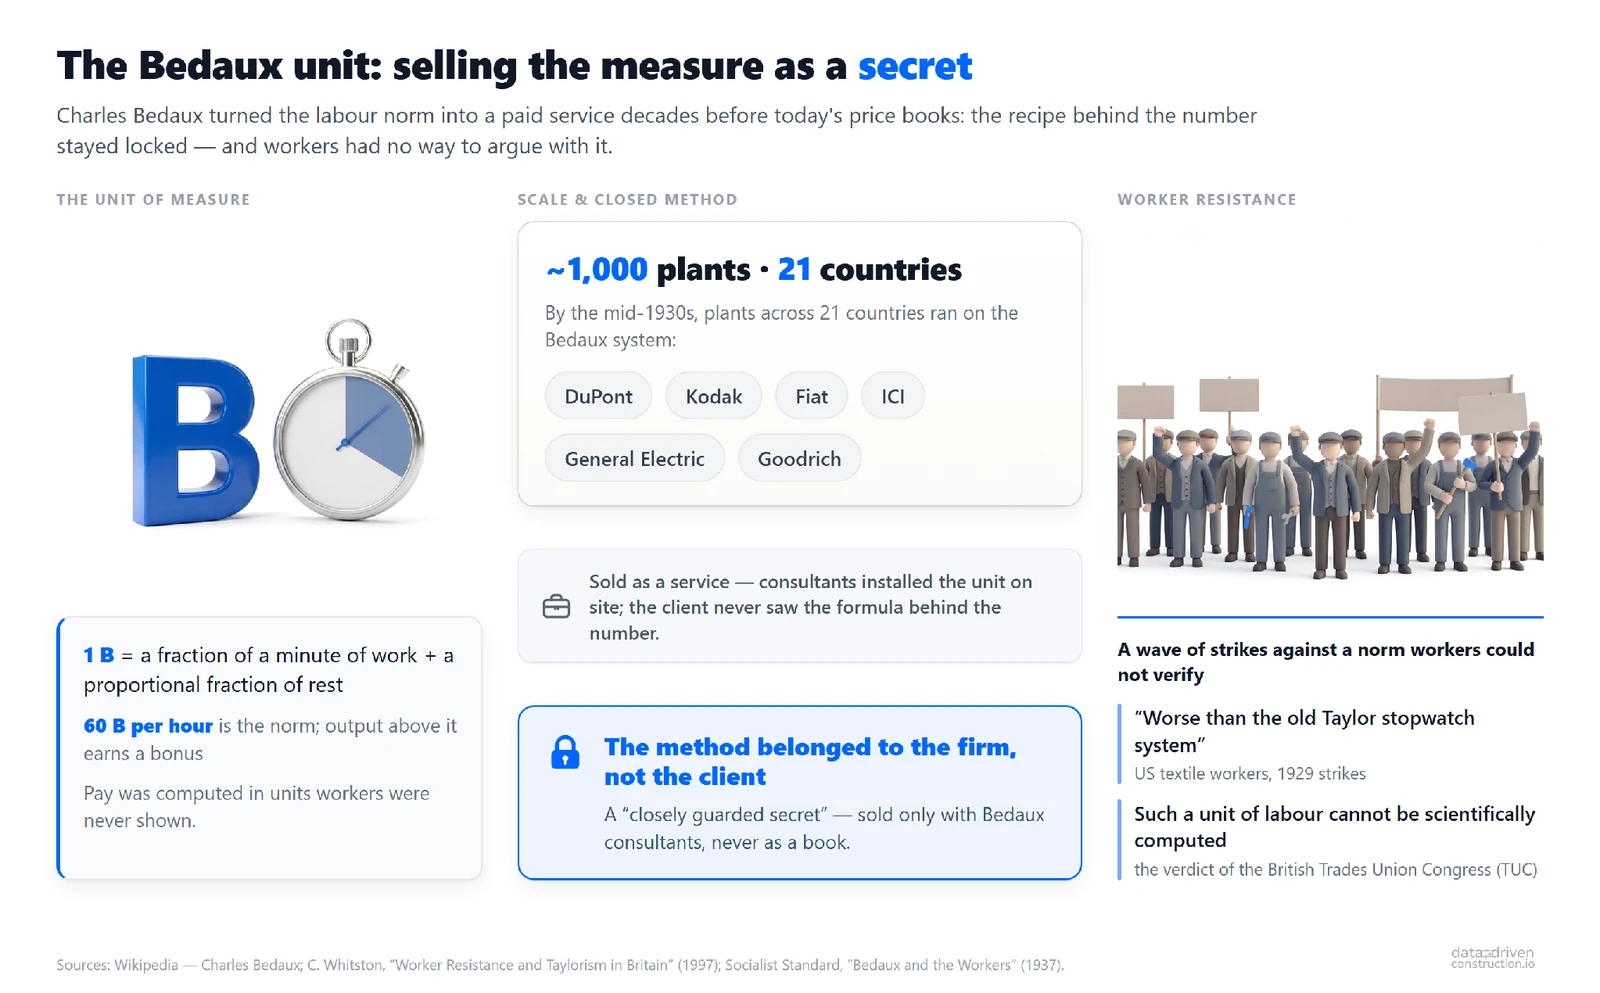
The key property of an open recipe, in contrast to Bedaux's book and its modern analogues: it can be copied endlessly and almost for free, and it does not diminish in the process. The resource norm is a recipe in its purest form. The composite (lump-sum) price in paid reference books is, by contrast, a finished dish: it is single-use, it cannot be recalculated for a different market, and for every new portion (every new edition of the book) you have to pay all over again.
Why the market chose the "price of the dish" - and why it is now returning to the recipe
There is no ill intent behind the rise of paid reference books; there is an understandable evolution of a business model. Market data is expensive to collect (30,000 man-hours a year at RSMeans), and a subscription remains a perfectly normal way to recoup that work. The composite price really is more convenient: it is faster to apply when costing, it does not require the estimator to keep the crew make-up and material consumption in their head, and for a huge number of tasks its accuracy is enough. For decades this was the market's optimal answer. But the model carries a built-in dependency.
The labour norm changes rarely, once a decade, together with the technology; prices live a life of their own and leap along with the market, especially over the past ten years, when material prices have shot up by hundreds of percent in a single quarter. Hence the fork in the road:
- A client who owns the resource norm buys the data once and from then on recalculates prices themselves: for their own region, their own wages, their own exchange rate. They are independent.
- A client with the "price of the dish" in paid reference books is forced to subscribe for life: an annual licence, a named user, quarterly updates. RSMeans does not even offer a monthly subscription - only an annual one.
The model needs no ill intent to create dependency: the dependency is not on the software but on the data. And this is not a verdict against the market, but a pointer to where it is evolving next.
For the client, the cost of leaving is always higher than the cost of staying: to drop a subscription to composite prices means rebuilding a resource base from scratch yourself, and that is expensive and hard, so it is easier to keep paying. What breaks this arithmetic is open resource bases that zero out the cost of exit: once the recipe is freely available through Open Source, you can no longer hold on to a client through opacity.
"Just as a restaurateur in the late 1990s had no wish for the internet to fill up with thousands of recipes for desserts and other dishes, so today the construction business does not want the client to know the full recipe for construction work. But sooner or later the customer-client will find out which ingredients go into the dessert and roughly what it should cost."
A state norm of the Turkish, Chinese or Soviet kind was a common good by compulsion - its openness was guaranteed by the state. Today, open data on the norms of different countries offers that same common good, but voluntarily: with no state monopoly, no compulsion, simply because it is more efficient for everyone.
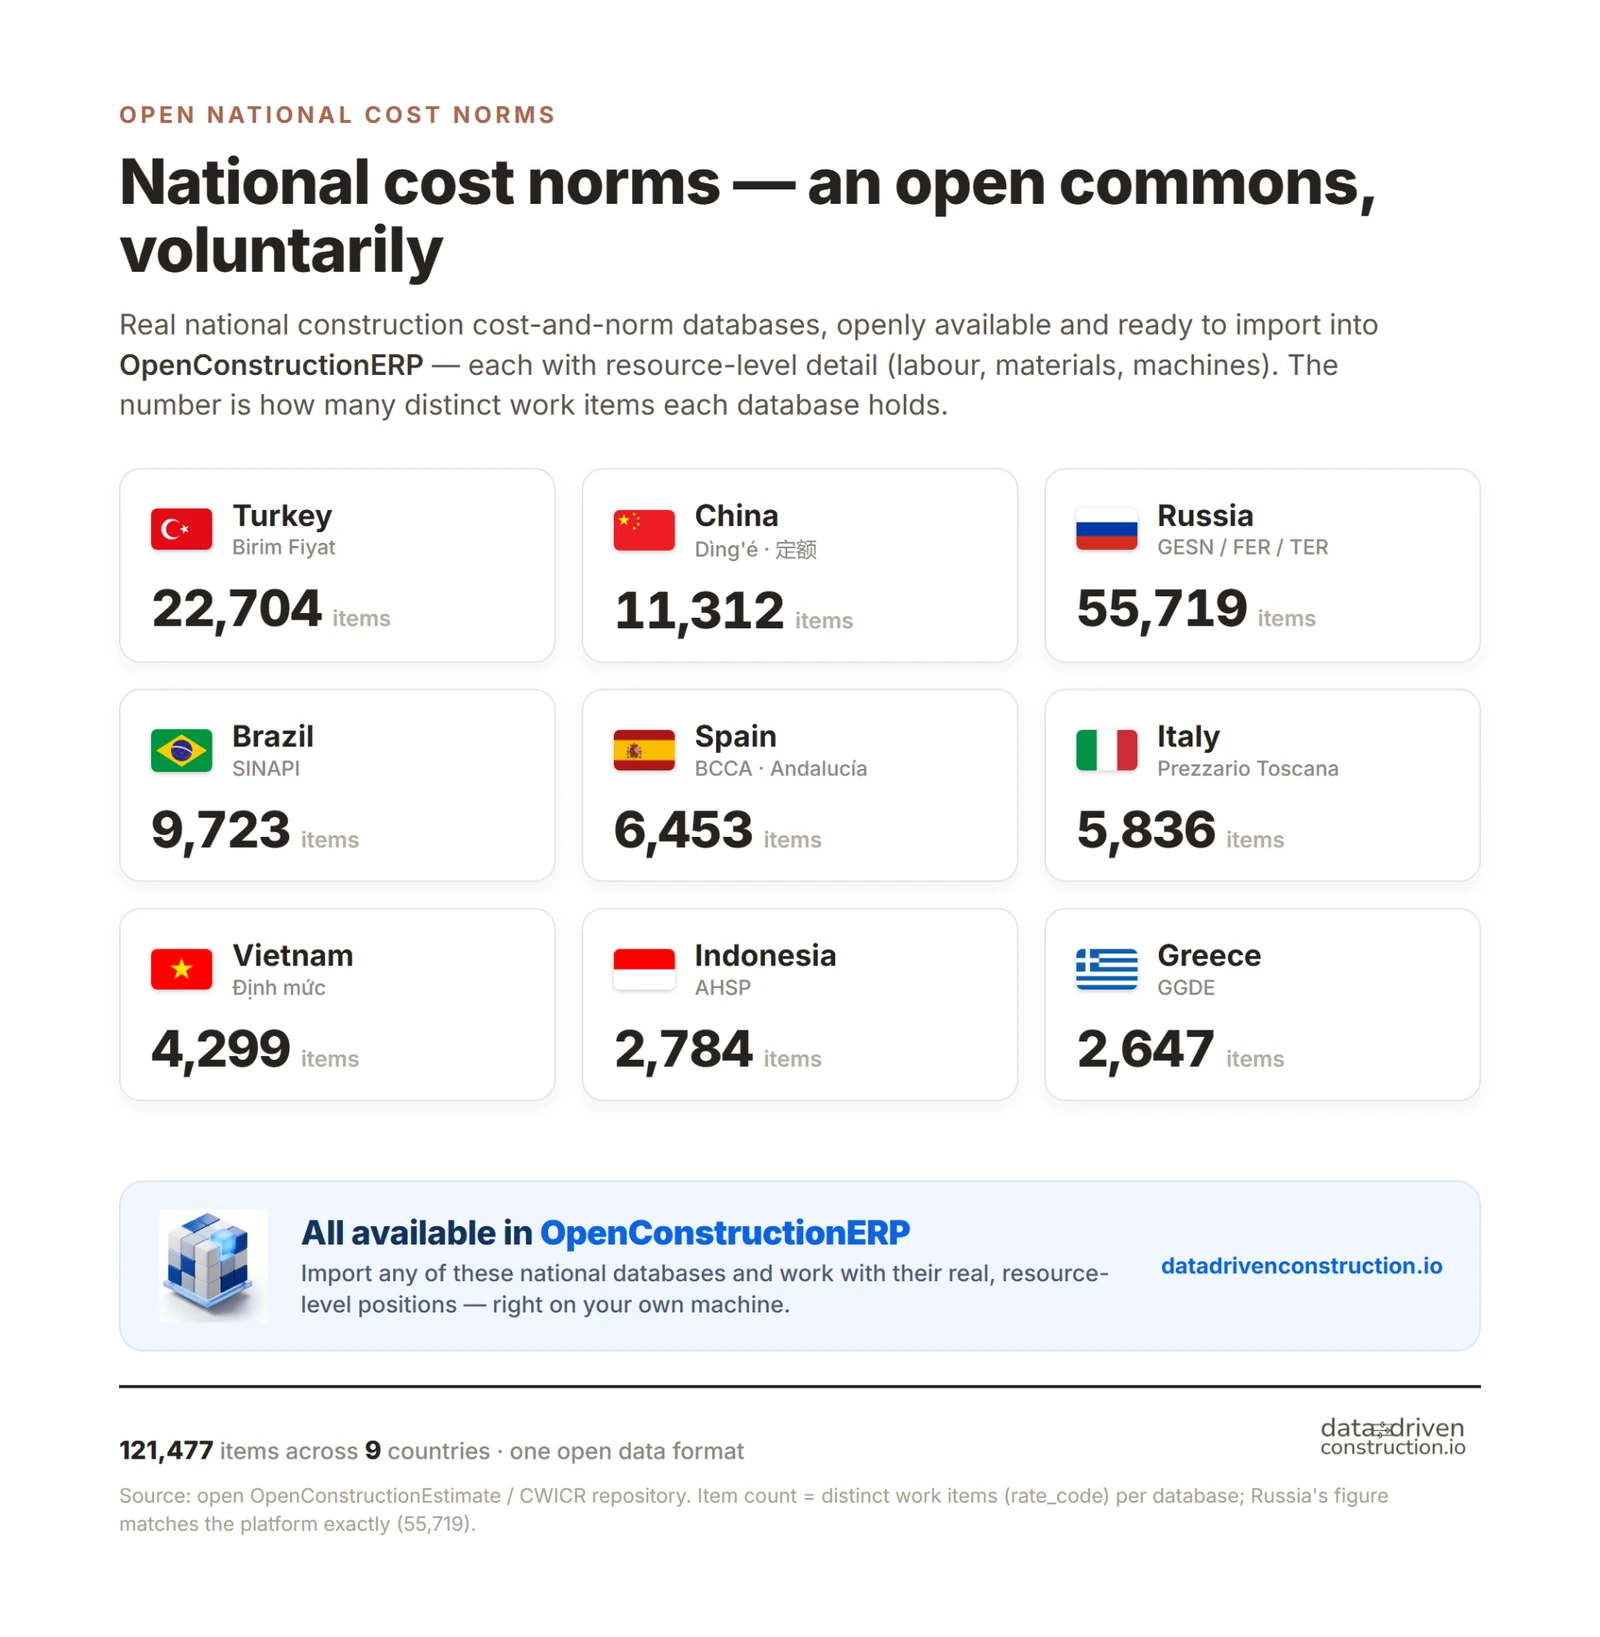
Anyone who has read my articles on the dependence of parametric CAD and IFC formats on the geometric kernel and on proprietary formats will recognize a familiar pattern here. In design, the complexity of formats and geometric kernels has historically kept the user inside the vendor's ecosystem. In estimating, the same role is played by the composite price without a resource breakdown. The mechanism is similar: the user gets a convenient result but not a way to reproduce it themselves. In CAD it is geometry without access to the parameters; in estimates it is price without access to the resources. In both cases the industry is now moving in one direction: toward the inevitable democratization of access and toward open data that can be recalculated and checked.
The norm is necessary but not sufficient: why there is no "single right price"
The norm is the foundation - without it nothing can be built - but on its own it is not enough.
Estimating construction cost is a forecast, not a mechanical calculation. A good estimate should answer not the question "what price is recorded in the database," but the question "at what price will the material actually be bought, the contractor engaged and the work carried out - with high probability - on this particular project, in this region, in this year."
The difference is fundamental: the norm (whether a Chinese reference book or the American RSMeans) gives a point - a single number. Reality, however, is a distribution. There are three reasons for this.
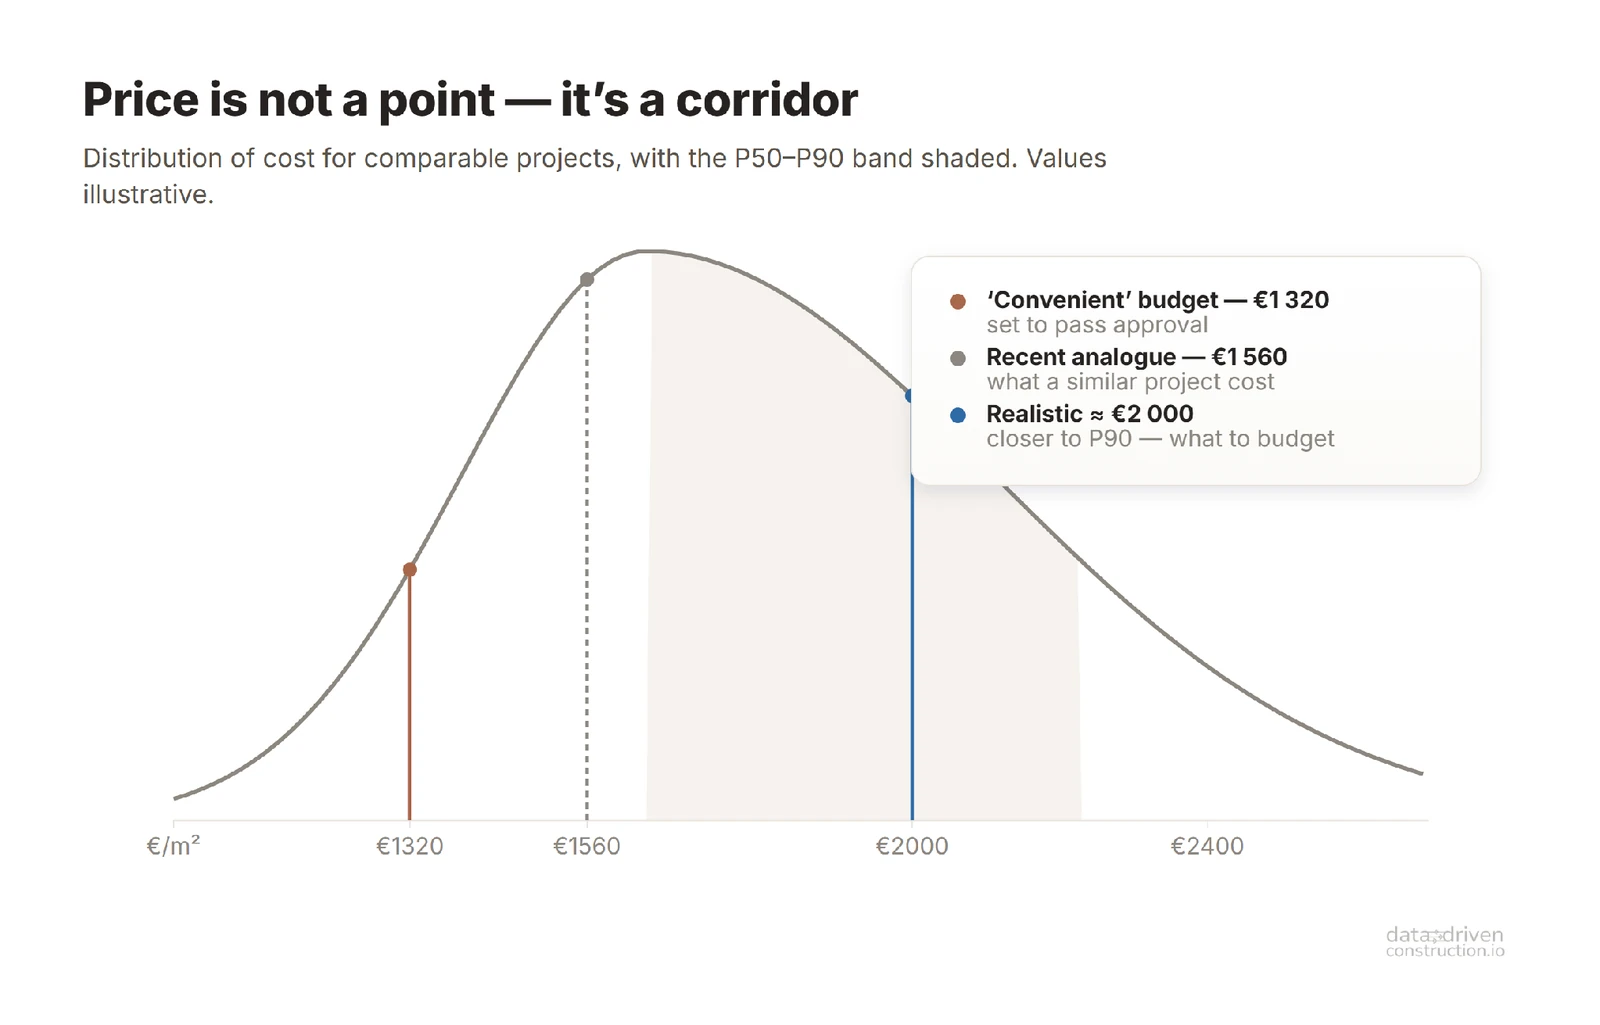
Reason one: a single right price does not exist in principle. Take Knauf plasterboard: the same material, the same SKU, the same purchasing department in the same company. The first buyer takes it at the going market price. The second has a standing discount of 20-30% through a contract with the supplier. The third, through a long-standing relationship with the supplier, gets 40-60% depending on the season. Three buyers in one and the same company, one material - three different prices for the project. Which of them is the "right" one for a reference book? None. There is no right price - there is a corridor, and the actual number depends on volume, supply channel, bargaining power, region, season, connections and the moment of purchase. Any single figure in an estimate is a minute-long, or rather a second-long, snapshot of a year-long corridor taken at one random instant.
Reason two: an estimate is often used not to forecast but to justify. Very often the real cost of a project is known in advance, but a politically, managerially or commercially convenient sum is written into the budget. And then the estimator is not forecasting the cost but justifying an already-fixed figure: building up the estimate to the exact sum the client named or the one that will pass expert review. A contractor who honestly says "you can't build this project for that money and on that schedule" often simply does not get the contract, while the one who agreed then slips into extras and extensions. In public procurement this gets worse: the cost is often understated at the early stages in order to contract more cheaply and show "savings." And then, during execution, the contractor claws back its 30% through additional works that are, informally, acceptable to the client.
In one of our communities a member gave a telling real-world example of the gap between the "convenient" figure and the real one. "A comparable project was recently built for €1,560/m². A new, similar one is being budgeted at €1,320/m². Even though several years have passed between the projects, there has been inflation and resource prices have risen, so it would be more realistic to allow closer to €2,000/m². Where did the €1,320 come from? Not from a calculation - from the wish for the project to clear approval." This example is exactly Flyvbjerg's strategic misrepresentation, only in the language of a specific site: here the budget is not a forecast but a way to win approval. And then projects like it honestly swell the "9 out of 10" statistics (Fig. 10).
Reason three: adding detail to an estimate does not raise its accuracy. The more detailed the estimate, the more accurate? In practice, more often the opposite. When an estimate is broken into thousands of lines (and sometimes into 10,000, with items of the "1 complex" variety on top of that), cost management turns into detective work and an endless argument - and litigation - over every micro-item between the client, the contractor and the estimator.
It has been established empirically that roughly 20% of an estimate's items make up about 80% of its cost. In construction economics this is called "cost-significant items" - items that are significant by cost (those whose cost is not below the estimate's average). In some categories of work the share reaches ~30%, but the order of magnitude is always the same: a small share of the items determines almost the entire budget. Source: the research group of R. M. W. Horner, University of Dundee; Dmaidi & Zakieh (2003).
In practice this means: by estimating only the significant ~20-30% of items, you can reproduce the total of the full estimate to within 5%.
This is a reproduction of the detailed estimate at the same unit rates, not a guarantee of hitting the project's actual cost - which still remains a corridor. In other words, 80% of an estimate's lines are noise that creates an illusion of precision and breeds disputes, yet has almost no effect on the result. For cost management it makes more sense to consolidate an estimate down to 20-100 clear items than to split it into thousands.
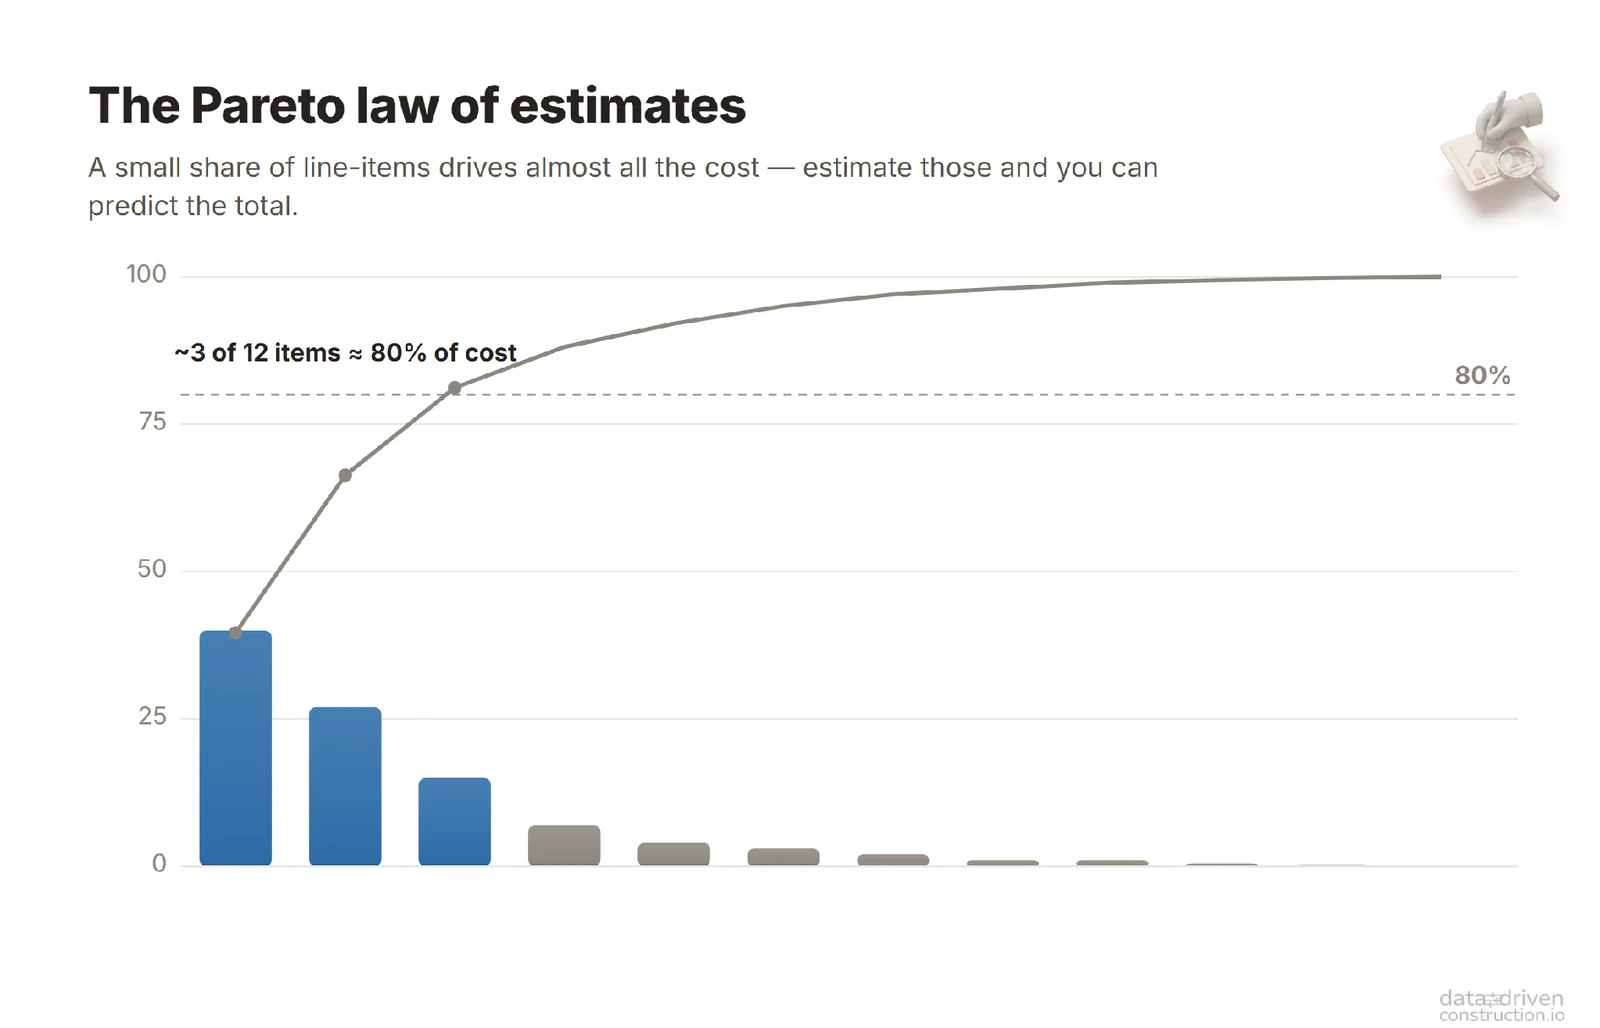
The completeness of the normative base and the depth of detail in a specific estimate are not the same thing. The base must be complete: every operation, from earthworks to finishing, must have a resource recipe - otherwise there is nothing to calculate with and nothing to train models on. But a specific estimate, for managing a project, should be "minimally" consolidated: it rests on the significant items, each of which has a full resource breakdown in the base, yet only those 20-30% that determine the budget are brought into the management field of view. The full breakdown lives in the base; the forecast works with the significant items. It is like Google Maps: under the hood there are millions of routes, but the screen shows you a handful of the most efficient ones.
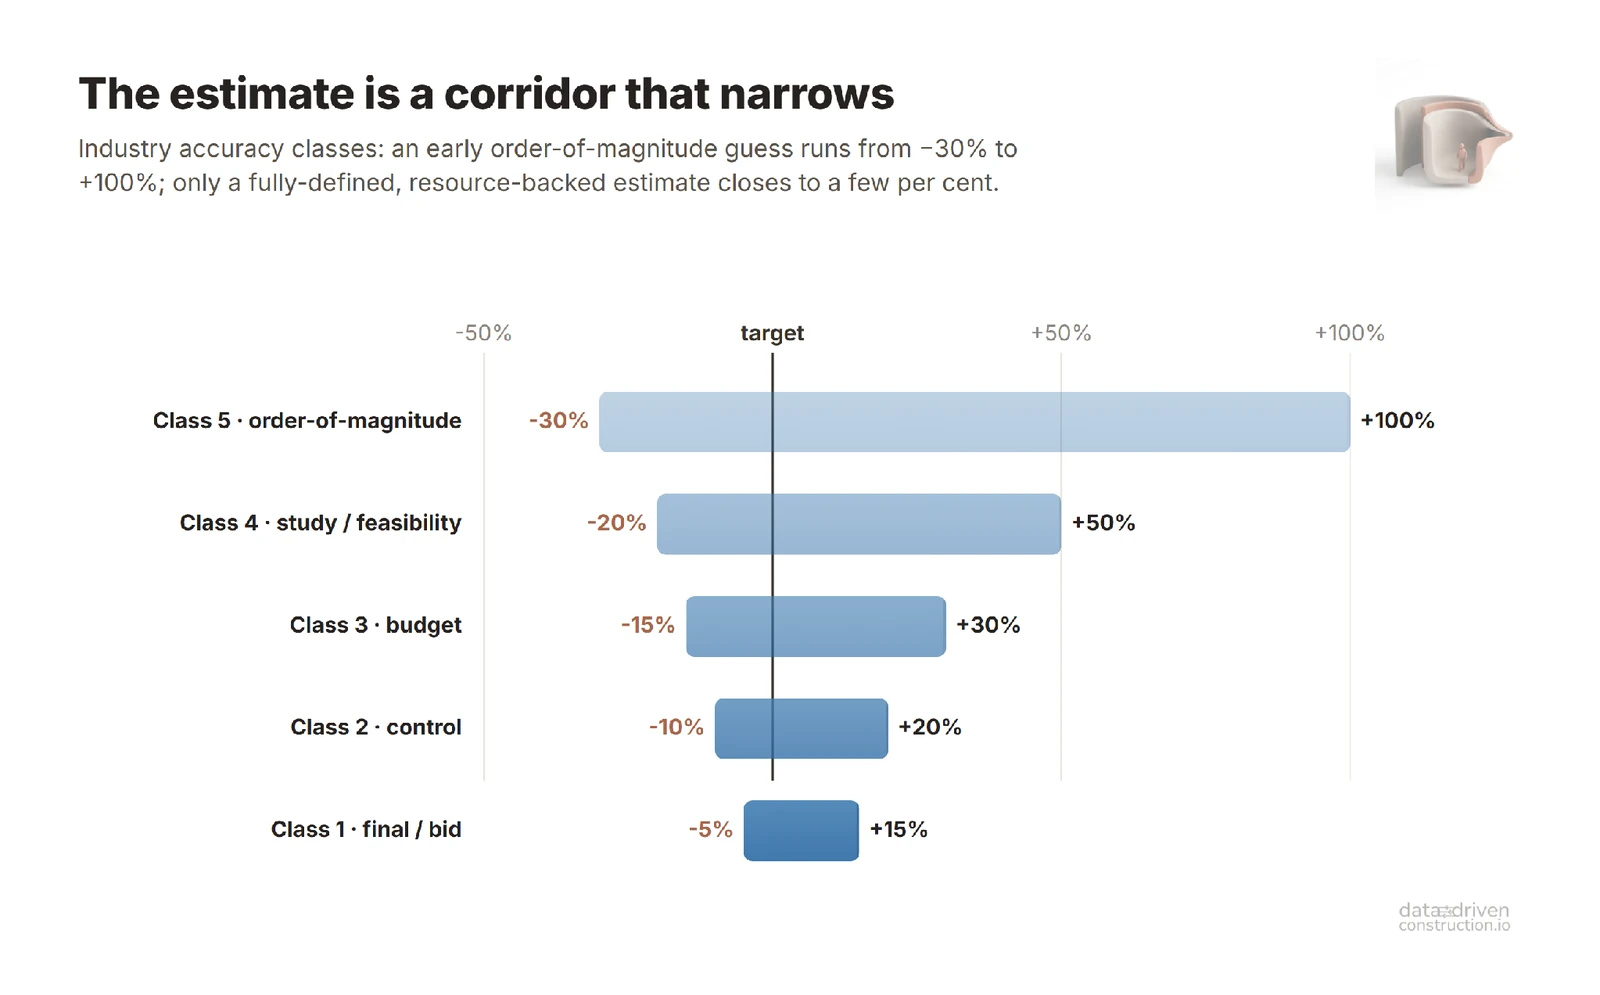
If there is no single right price, if detail does not save the day, and a point-estimate turns all too easily into a tool of self-deception, then the answer lies not in an "even more accurate reference book" but in the shift from the estimate-as-number to the estimate-as-forecast: showing not one figure but a corridor - minimum, median, maximum, the confidence of the data, and risk factors with their percentages.
This is how the AACE International methodology works: it builds the estimate outright as a range with a confidence level (P50, P90) rather than as a point (AACE Recommended Practice 41R-08, Understanding Estimate Ranging).
The earlier the stage, the wider the corridor; the industry long ago boiled this down into accuracy classes:
Part of a foreman's experience fundamentally will not fold into a table in any case: it is contextual, situational, it lives "in the fingertips." And here the norm meets its limit: it confidently describes cost-significant work - those 20-30% of items that carry the bulk of the cost and recur from project to project - and it weakens on the long tail of non-standard solutions, where engineering judgement begins. Uberization here does not claim to digitize that judgement; it removes uncertainty through a percentage laid on top of the norm wherever the norm exists and the work repeats, and it says plainly where the data ends and the human begins. But in the part of construction where the money is concentrated, the norm is, precisely, always there.
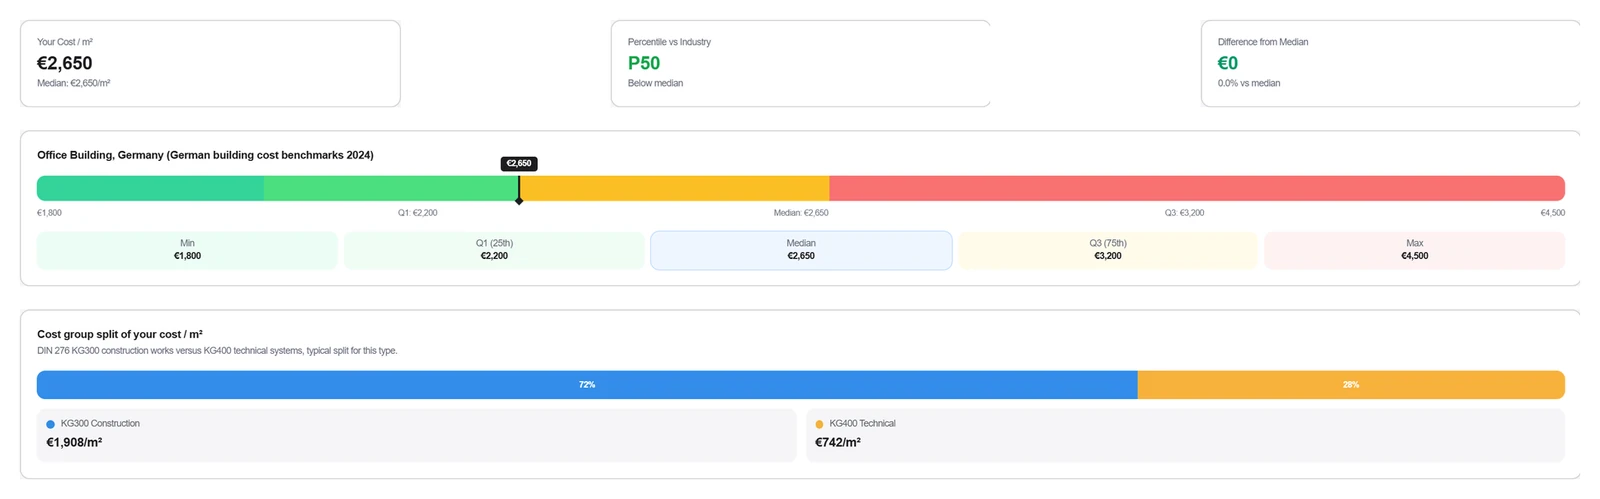
Put three things together - the resource norm as a foundation with a percentage corridor, live market data on real purchases, and contractors' performance history - and what you get is not a reference book but a navigator: a "Google Maps for construction" that shows a corridor rather than a single figure. What remains is to understand how it is built technically, and why it has not existed in digital form until now even though all the pieces have long been in hand. What stands in the way, strangely enough, is the very technological trend that has dominated the past twenty years.
Uberization: the recipe in the client's hands
What remains is to put the whole thing together: to understand why it never assembled itself over twenty years of digitalization, and to see what - besides cost overruns - grows on that same opacity.
CAD-BIM digitized the building, but not the work
What is a CAD (BIM) model through the eyes of an estimator? It is a database of element groups: the group of types in the "wall" category knows its own volume, material, and class. What it does not know is how many man-hours it takes to build it. The very 5D-BIM the industry has been talking about for twenty years runs up against this missing link: the element is there, the aggregated price is there, but there are no open norms between them.
Twenty years of digital - and no growth in productivity
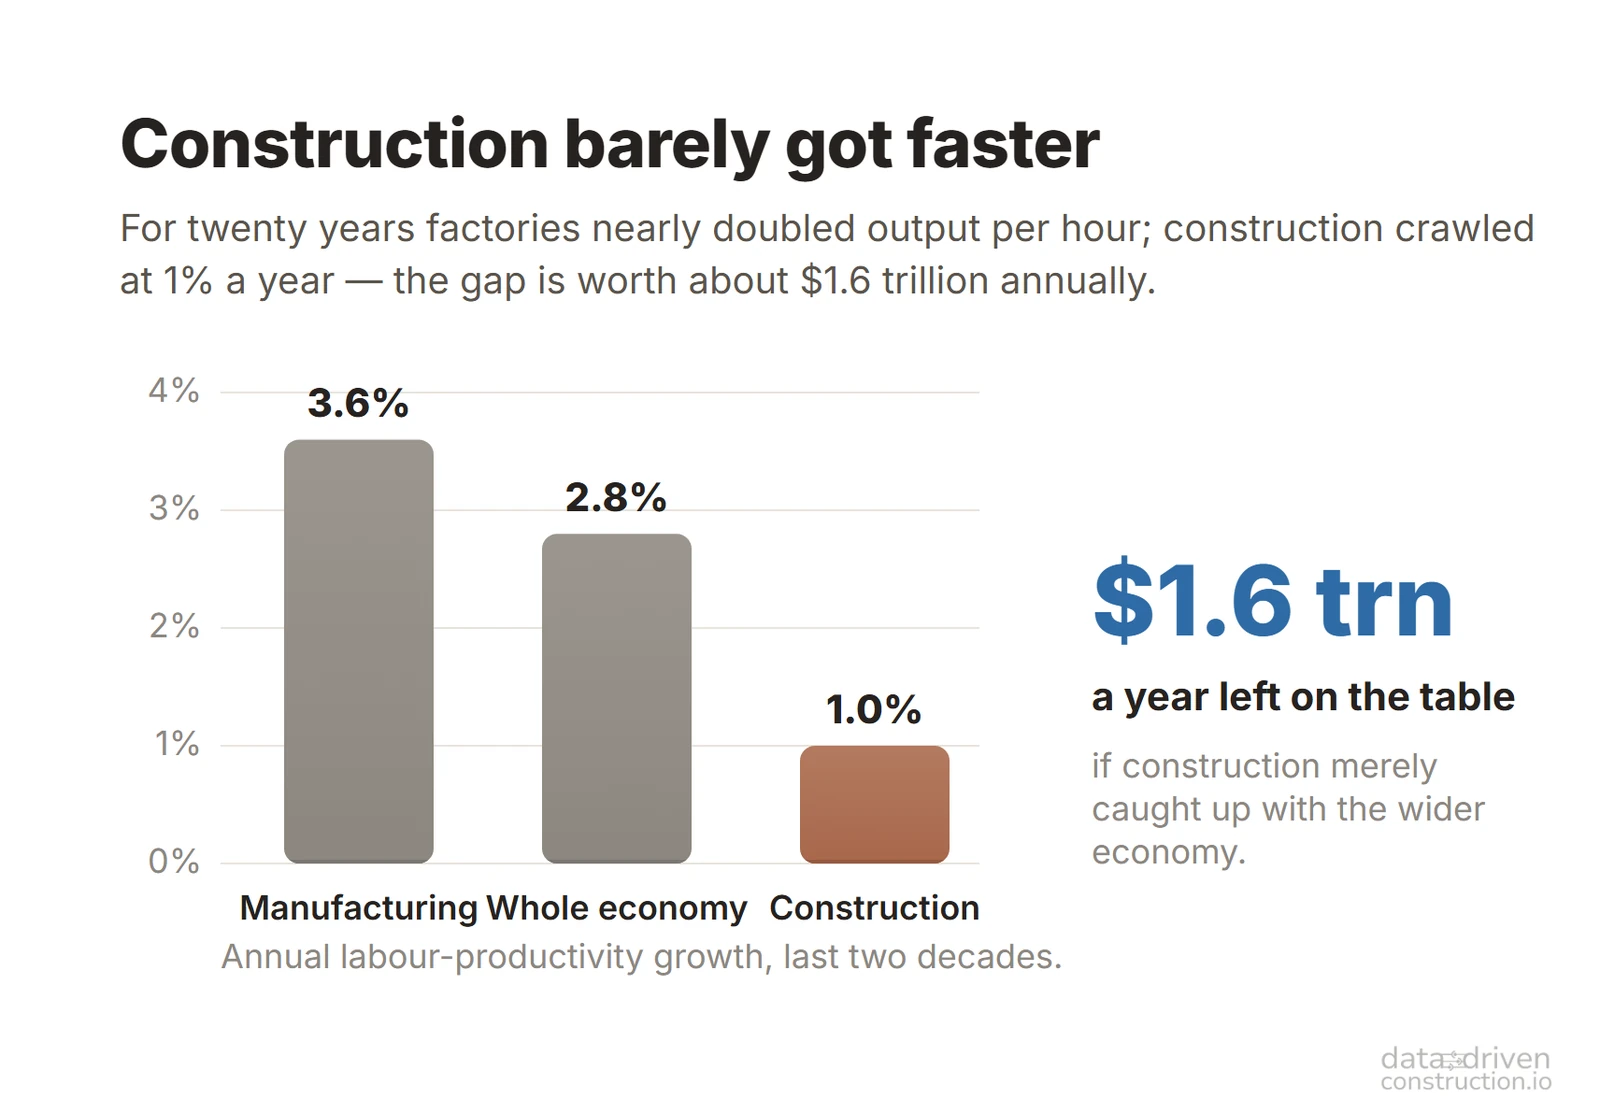
We have plenty of project data: CAD (BIM) models, cost estimates, schedules, ERP, procurement, acceptance certificates, photo documentation, drones, sensors. CAD knows what to build, the estimate what it costs, the schedule when, ERP what was bought. And only the site foreman knows how it is actually done. Between these layers there is no common language - no single model of the work itself that they could all attach to. BIM turned out to be a marketing revolution, not a productivity revolution. That is why BIM on its own does not remove overruns, and 5D so often stays a "cost estimate glued to the model."
Over the past decades, companies have invested substantial sums in modular ERP systems, treating them as long-term integrated solutions.
According to the Software Path report for 2022, the average budget per ERP-system user is $9,000. On average, about 26% of a company's staff use such systems. So for an organization with 100 users, the total cost of an ERP rollout reaches roughly $900,000.
Investment in proprietary, closed modular solutions is becoming ever harder to justify against the rapid rise of modern, flexible, and open technologies. Where such investments have already been made, it is worth reassessing the role of the existing systems objectively: are they truly still necessary in the long run, or could their functions be rethought and delivered more efficiently and transparently? One of the key problems with today's modular data-processing platforms is that they centralize data management inside closed applications. As a result, the data - the company's core asset - becomes dependent on specific software rather than the other way around. This limits the reuse of information, complicates migration, and reduces business flexibility in a fast-changing digital landscape.
If there is a chance that a closed modular architecture will lose importance or relevance in the future, it makes sense to recognize the costs already incurred as sunk today and to focus on a strategic shift toward a more open, scalable, and adaptive digital ecosystem. Proprietary software is defined by the developer company's exclusive control over the source code and the user data created while using such solutions.
Unlike open-source programs, users have no access to the internal structure of the application and cannot review, modify, or adapt it to their needs on their own. Instead, they are required to buy licenses that grant the right to use the software within the limits set by the vendor. The modern, data-oriented approach offers a different paradigm: data should be treated as the primary strategic asset - independent, durable, and separate from any specific software. Applications, in turn, become merely tools for working with the data, tools that can be freely swapped out in the era of ubiquitous AI agents without any risk of losing critical information.
...the old approach to this [data] question was as follows: if you recall how various business applications handled integration, they used connectors. Companies sold licenses for those connectors, and a business model formed around that. SAP [ERP] is one of the classic examples: SAP data could be accessed only if you had the right connector. So it seems to me that something similar will emerge in the case of [AI] agent interaction [..]. The approach we, at least, are taking is this: I think the very notion that business applications exist will probably collapse in the age of [AI] agents. Because, if you think about it, they are essentially databases with a pile of business logic on top.
- Satya Nadella, CEO of Microsoft, interview on the BG2 channel, 2024.
The norm-setters of the twentieth century - Chinese, Indian, Soviet, and Western alike - built an "analog ERP-CAD" long before computers and AI agents. 定额 (dìng'é), RSMeans, ENiR are a dataset that ties a project element to resources, time, and money. Just printed on paper, not yet linked to geometry, and not stored in a database that an AI agent could easily talk to today.
Any norm is one and the same triplet: the work, its resources, and the norm of time and conditions. A Sumerian scribe, Vauban, Gilbreth, and the compiler of ENiR all wrote this same triplet, just with different marks and a different alphabet. This triplet is exactly what a CAD-BIM model needs in order to stop being merely pretty geometry.
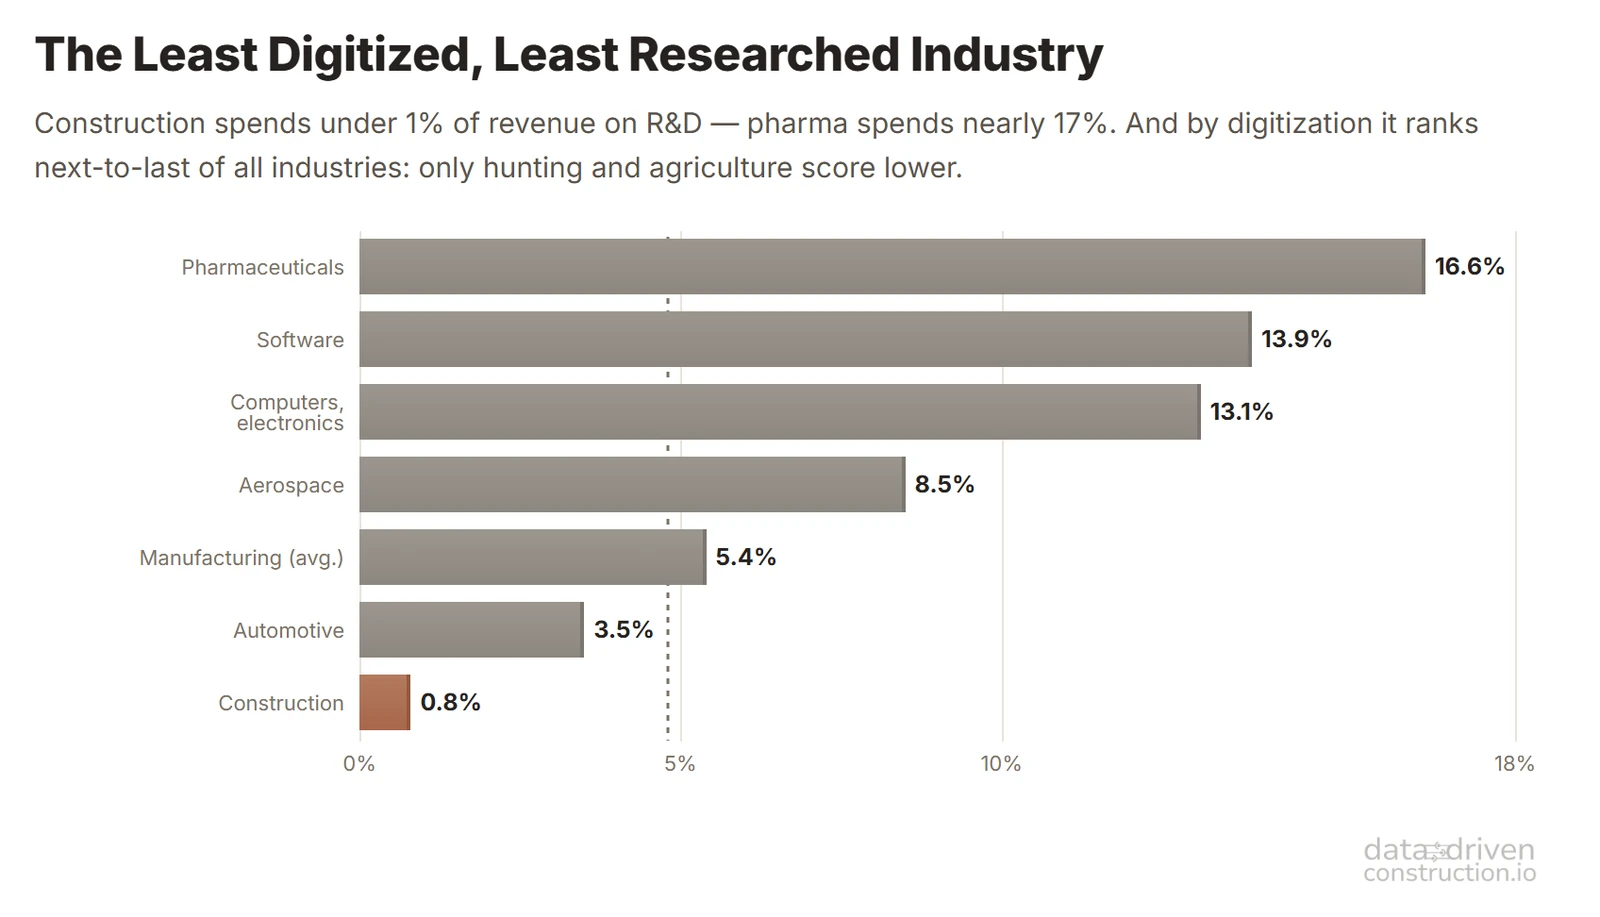
Over twenty years, the construction industry poured enormous money into 3D geometry, into Frankenstein construction ERPs, into a zoo of formats and cloud SaaS solutions, while construction productivity, according to McKinsey (Reinventing Construction, 2017), barely grew. The money went into the 3D picture, not into the norm.
The missing layer: how a quantity finds its work
Even where the norm exists, between the geometric element and the norm there remains one more layer, the one on which most 5D projects break down: the mapping. A quantity is not yet work. A single cast-in-place wall from the model unfolds not into one priced item, but into a chain: formwork, reinforcement, concreting, curing, stripping the formwork, and each operation has its own norm and its own unit of measure. For the wall to find its norms on its own, the element needs a code and the norm needs a mapping rule; this is what classifiers are for (Uniclass, OmniClass, ISO 12006, the bSDD dictionary, and thousands of in-house and country-specific classifiers for every use case), together with a layer of rule-based tagging. In closed, complex ERPs every company builds this layer anew and at its own expense. In an open system, the mapping rules become just as much part of the common good as the concrete consumption in a norm.
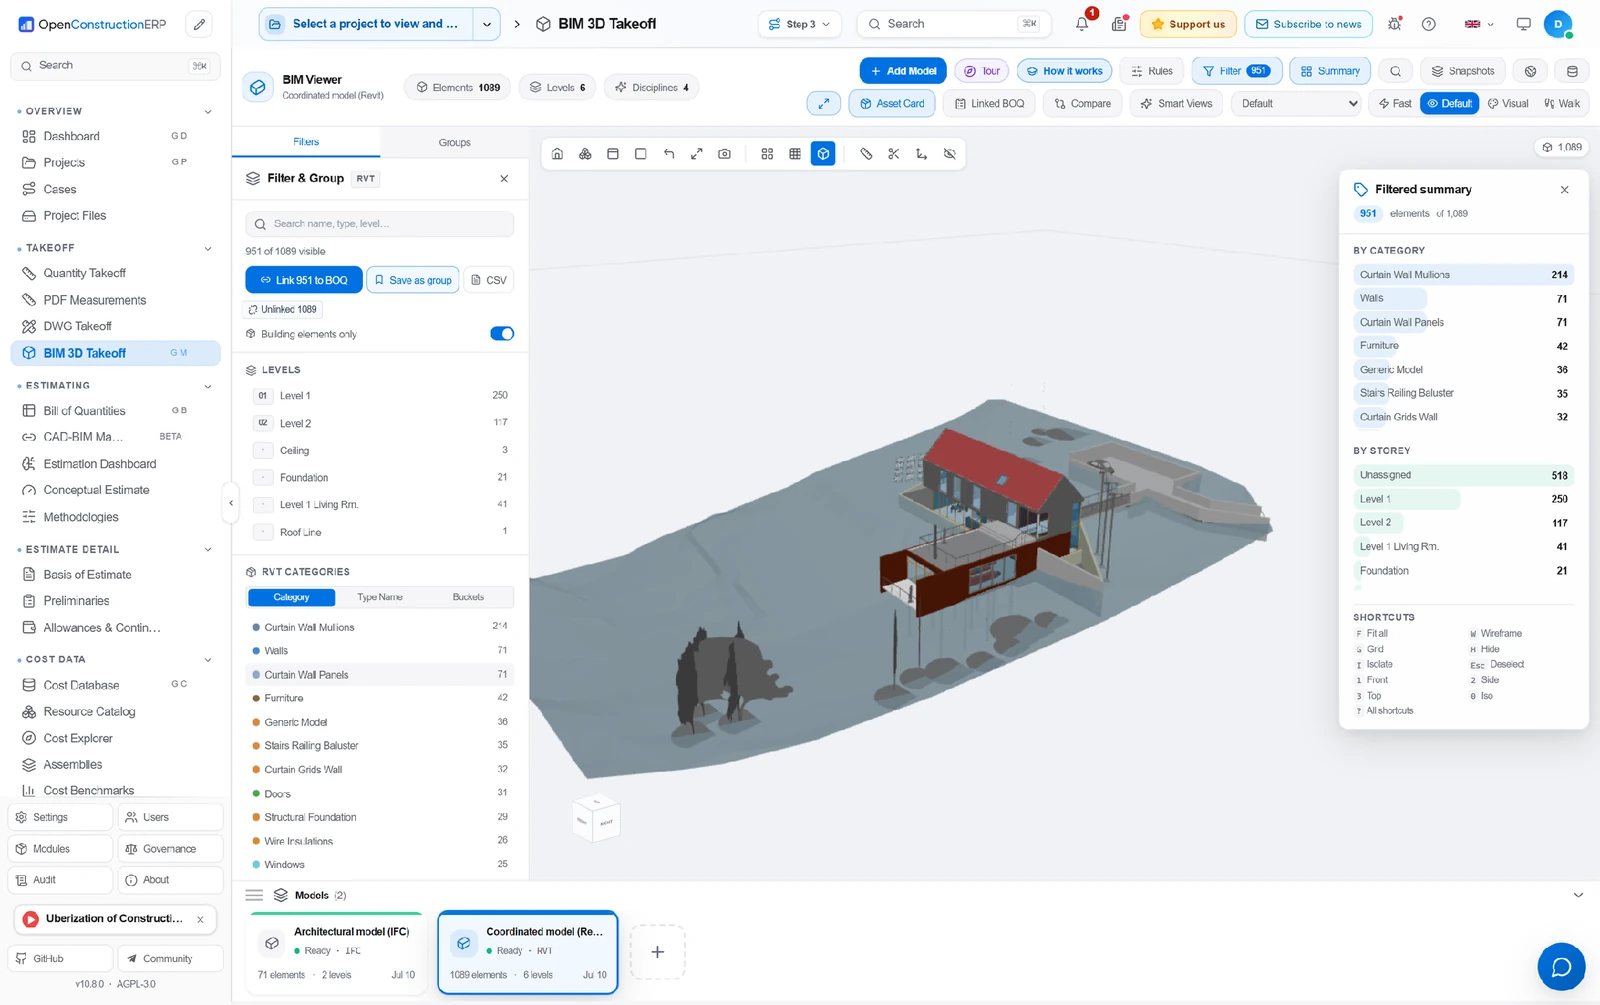
The existing construction ERPs capable of tying a CAD/BIM model to a rate database usually turn out to be closed corporate systems costing tens, and more often hundreds, of thousands of euros in subscription per year. And even they solve only half the task: they have the matching tool, but a ready, built-in database of resource norms for different countries is almost nowhere to be found. The user gets the "engine" but not the "fuel" for it. Open tools that connect both halves (extracting data from closed formats and mapping it to the resource norms of national systems) are still a handful; one such pipeline is shown further on in the screenshots: an open norm database is plugged into the geometry, and a quantity becomes a verifiable line-by-line price.
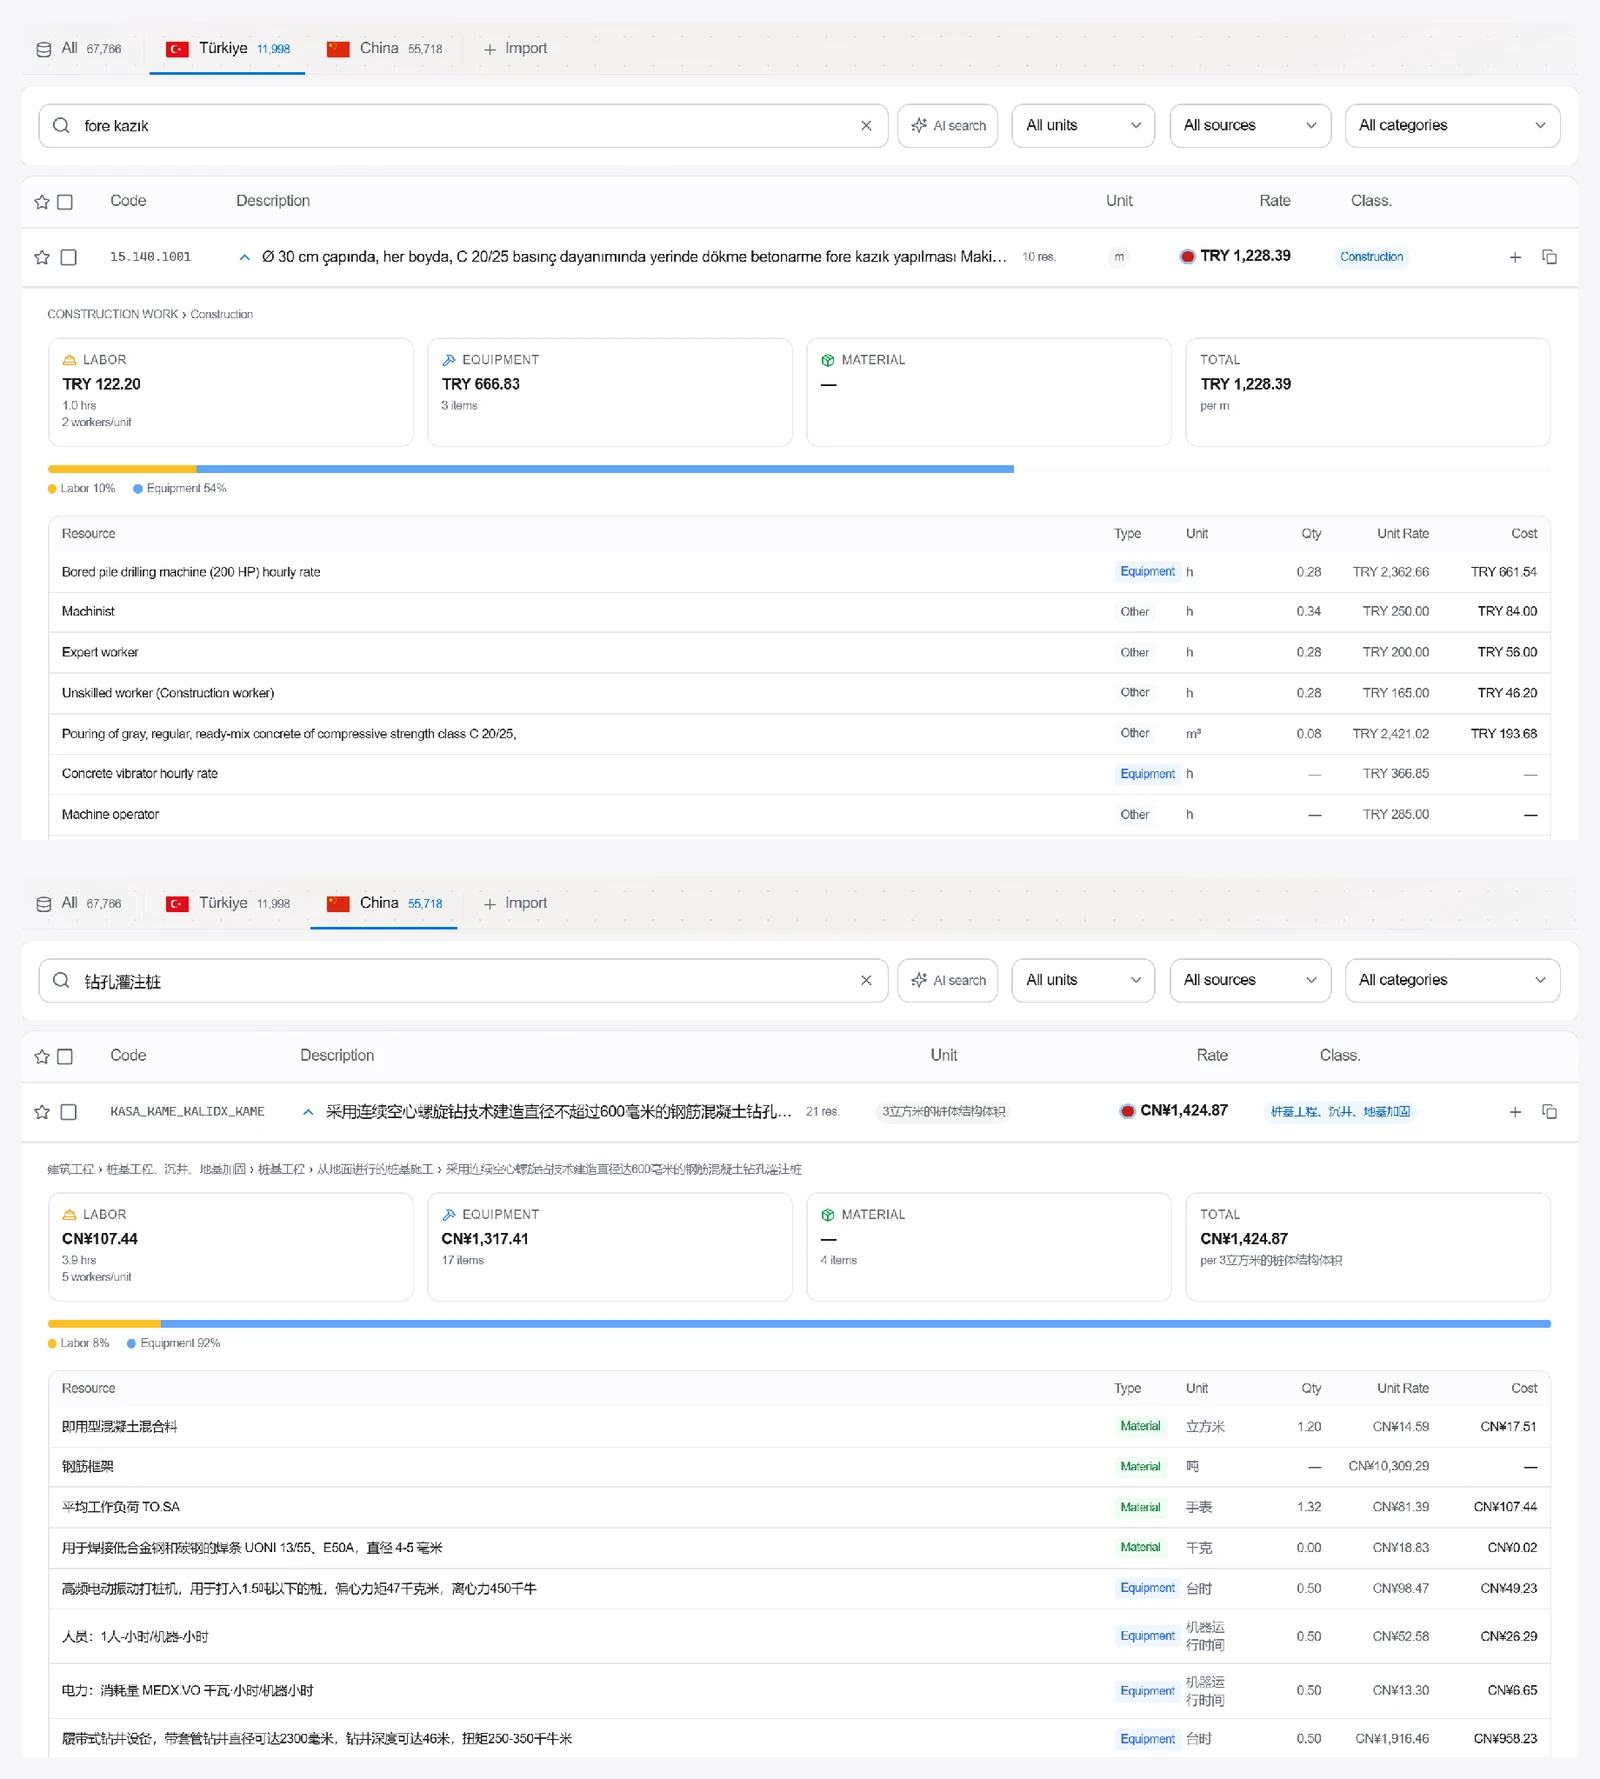
Inside each item is the very same triplet: the crew's man-hours, materials, and machine-hours.
That is why real 5D adoption without open-source ERPs will stay low even where 3D models have long been the norm: there is simply nothing with which to connect geometry to a rate.
The estimate as a simulation: the genome of the work
Geometry in construction is ultimately needed for one thing only: to turn lines and quantities into money. A wall's quantity is useless on its own. It becomes meaningful only when multiplied by a norm: so many man-hours per cubic meter, so much material, so many machine-shifts. This entire route - from the automatic extraction of quantities (QTO) from CAD (BIM) models to the resource-based estimate and 4D/5D calculations - is worked through step by step in the fifth part of the book Data-Driven Construction.
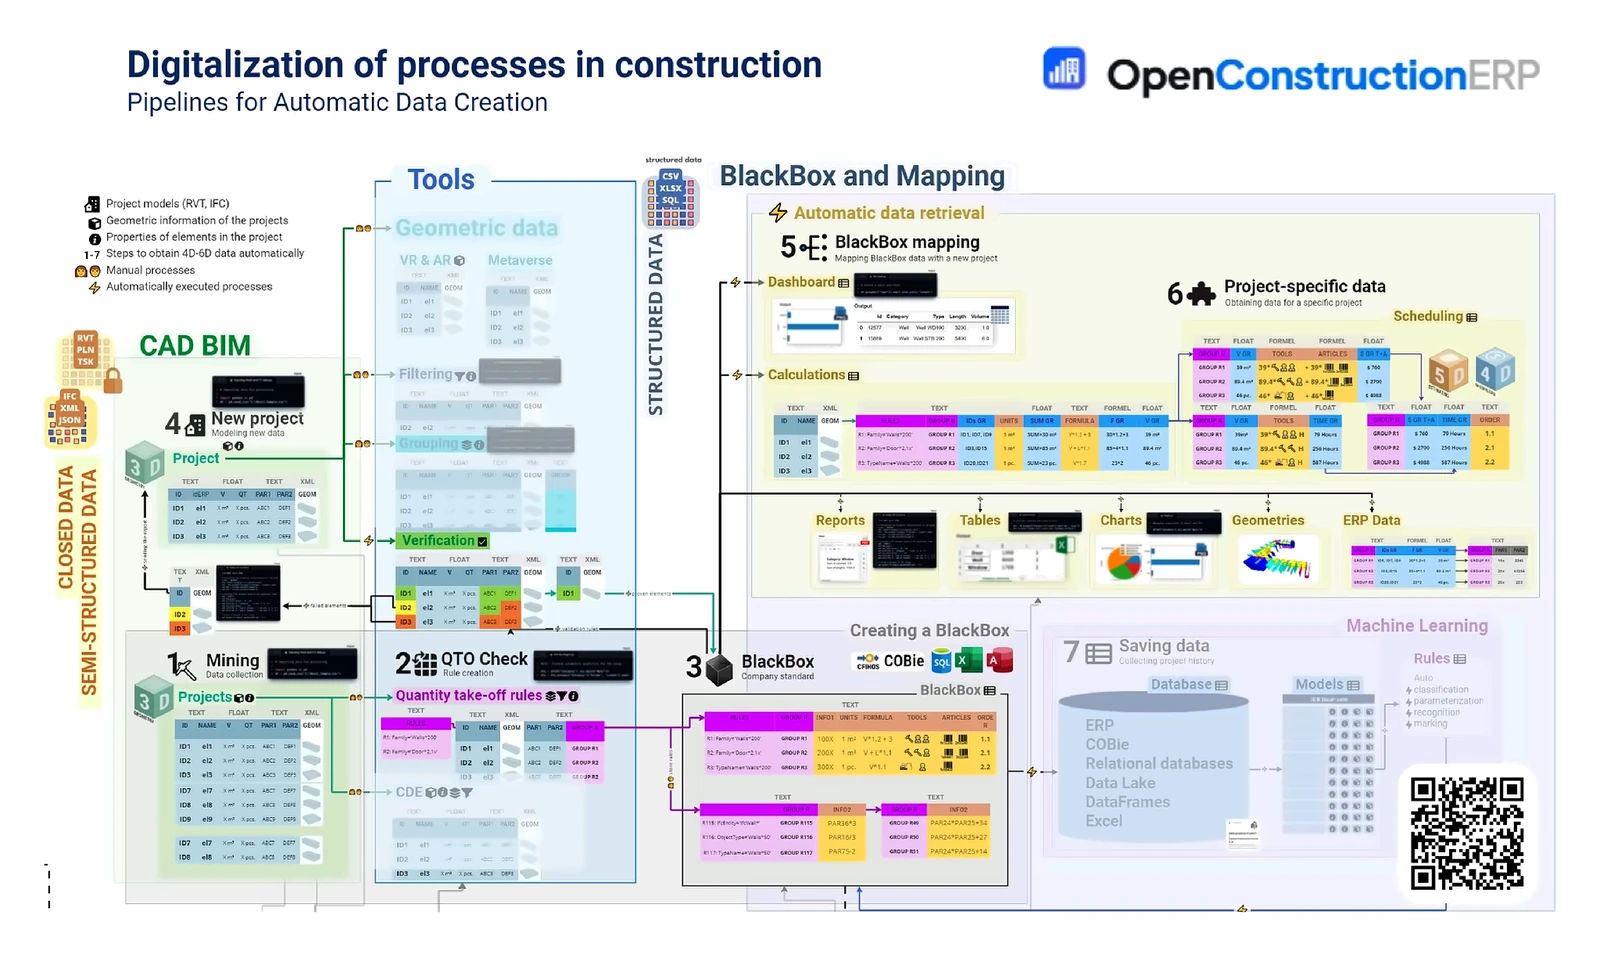
A digital open layer of the work will appear anyway: robots, digital twins, and AI all rest on it. The only question is whose data it will be built on: on proprietary formats and closed subscriptions from an engineer Bedaux, or on open formats and open rate databases. And whether it will be, like the stopwatch in the hands of early Taylorism, an instrument of pressure - or a shield against chaos.
An estimate that does not understand resources is not a model of construction. It is an opinion about price, dressed up as a document.
This is a question of survival: construction firms die not from a lack of orders, but precisely from the gap between the promised price and the real economics of production. The absence of a reference and an example, and the resulting error in the norm, breaks the schedule; a broken schedule opens up a cash-flow gap; and after that come claims, delays, disputes, and bankruptcy. And the price of this error is not only monetary: the unrealistic deadlines baked into an underpriced estimate drive the site into a scramble, and the scramble ends in injuries and lost health for people. A wrong norm ultimately hits people and their families, not just the budget. The estimate must stop being a paid, closed document about price and become a simulation of how construction will actually go. The "crane or pump" difference from the chapter on Türkiye and India can be played out here on live data: one wall, two methods, two prices.
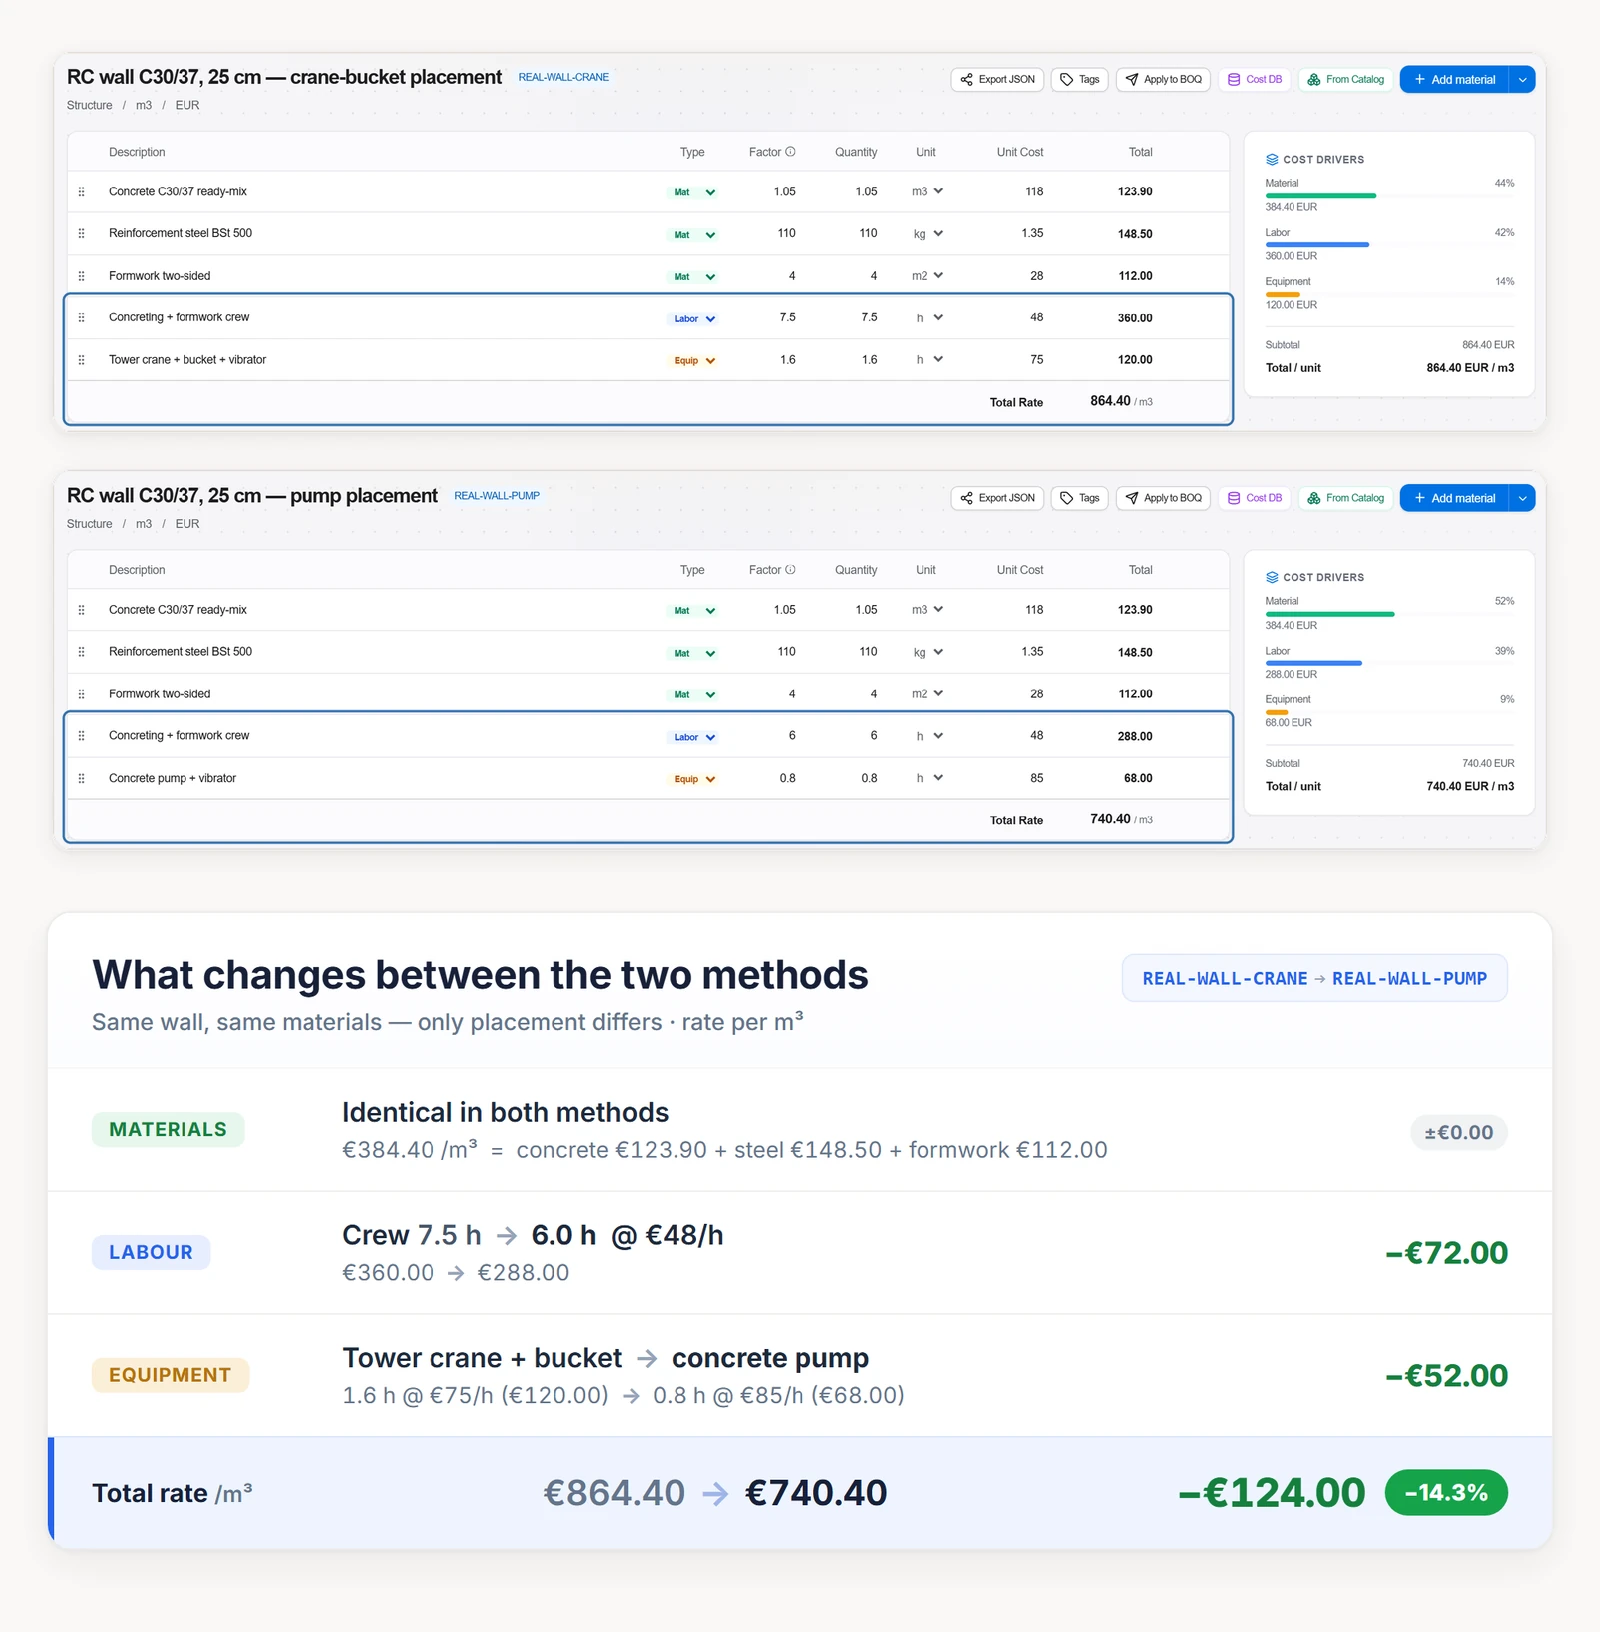
The cartel: collusion grows on the same soil
The whole theme of norms and describing work through resources is an answer to opacity. Until now, opacity has simply driven the price up - through overruns, disputes, and lost margin. If the client cannot see the real cost of the work, and contractors meet at the same tenders year after year, sooner or later the temptation arises to arrange things among themselves. This is called bid rigging, and construction is one of the industries most infected by it in the world.
The state, knowing how corrupt the whole construction sphere is, has for several thousand years been forced, precisely because of this, to control and describe the "cooking recipes" of construction projects.
The generalized scheme that antitrust authorities around the world have been recording for decades: there is a large client and a narrow circle of contracting companies that regularly submit prices to it. Formally, the client picks the best offer on the market. In practice, the heads of these companies agree in advance on who will put what price on which project.
These contractors gather once a year, or often travel to another country, and agree on what price to bid on which project. To the client, it looks like a free market.
The logic of the split is often utterly "engineering": the job goes to whoever already has a crew and equipment standing closer to the new site, so as not to bother with the costly relocation of people and equipment. The others submit deliberately higher bids for show. The tender takes place, the envelopes are opened, the protocol is published. But the winner was known in advance.

Almost every element of this scheme is repeated word for word in the real cases of antitrust authorities in nearly every country - the pattern is the same everywhere the client has no transparent data.
The same handwriting - the world over
Germany, the industrial cartel around ThyssenKrupp (uncovered in 2023). For more than ten years, 14 construction companies divided among themselves the orders of large industrial clients, including ThyssenKrupp; some 178 contracts in all, worth roughly €60 million. The mechanics, as described by the Bundeskartellamt: over the phone they agreed on who would get the order, the chosen firm calculated it itself and sent its estimate to the others so that they would submit higher "cover" bids. The total fines imposed came to about €4.8 million Bundeskartellamt, 14.12.2023.
Canada, the Charbonneau Commission, Montreal. Here the scheme was described under oath. About a dozen companies engaged in earthworks and sewer work divided the city's contracts among themselves: when a contract fell to one firm in turn, it was the one that told the others what amount to bid so that it would come out as the lowest "compliant" bidder Charbonneau Commission. As a result of the investigation, the province of Quebec recovered about $95 million to the budget through a voluntary reimbursement program.
The Netherlands showed that a cartel does not even need connections and threats - a culture of careful bookkeeping is enough. In 2001, former director Ad Bos handed the authorities the shadow accounts of the firm Koop Tjuchem: a second set of books in which construction firms had for years kept mutual "settlements" for the tenders they ceded to one another. A parliamentary inquiry (final report, December 2002) established that collusion was practiced by almost the entire sector, that clients were on average billed 8.8% more, and that the antitrust authority ultimately fined about 1,300 construction companies a total of €406 million. In Quebec the collusion was held together by connections and threats; in the Netherlands, by neat tables of mutual debts.
Spain: €203.6 million in fines for the six largest companies over 25 years of coordinated bids (CNMC, 2022); South Africa: around 300 projects with traces of collusion, including the 2010 World Cup stadiums (Competition Commission SA, 2013). And in examining the road builders' collusion, the Bundeskartellamt captured the very mechanism of geography: hot asphalt is not hauled far, the market is regional by nature, and so the circle of participants is narrow (Bundeskartellamt, 2025).
Different legal cultures, different eras, but the mechanics are one and the same: a narrow circle of familiar players, recurring tenders, division by geography, "cover" bids, compensation for the losers through subcontracting. It is not about national character: collusion grows on a certain soil by itself.
The soil is the same everywhere. The market is local: heavy equipment and hot asphalt cannot be hauled far, so competitors are tied to a place and have known each other for years. Tenders recur: one project today, another tomorrow, there is something to divide and something to compensate with. Entry is hard: you need equipment, licenses, reputation, so the circle of participants is narrow and stable. And most importantly, when no one sees the real cost of the work and the work norms, a collusively inflated price cannot be caught red-handed. Collusion lives in the same fog as an ordinary budget overrun.
Why open data knocks out the cartel
A cartel rests on two supports: the client cannot see the market price, and the contractors are confident that their arrangement has nothing to be compared against. A navigator platform of uberization will inevitably knock out both.
Once open, simple calculators reach the client - first the banks, funds, and large clients, then everyone - cheating becomes hard. For the first time the client will see two figures side by side: the real price of work and materials, and the one written in the estimate. The gap between them is precisely the markup, both ordinary and cartel, and it will shrink. Uberization through platforms like these presses on collusion from two sides at once: it opens up the resource norm, so that the true price is now known to everyone rather than to the cartel alone, and it shows the full spread of real deals, where an inflated price sticks out for all to see, the way an overpriced ride would stick out from an Uber fare. And if contractors are compared by their past jobs rather than by their promises, the throwaway bids submitted deliberately to lose - just so the "right" winner looks honest - also lose their point.

People have already learned to catch collusion right in the numbers of the bidding: programs already recognize it by prices that are too even and by unnatural gaps between bids, and on Swiss data they detect more than 84% of tenders, even with an incomplete cartel. This does not repeal the law - secret collusion remains a crime.
Transparency flips the calculation: today it pays to collude because getting caught is a distant risk while the profit is near; in an open market the deviation is visible at once, and collusion stops paying off.

How the uberization of construction will work
Let's assemble the whole construct. In place of a reference book of "correct prices," a dynamic system of reference points, built on a variety of open databases of works described through resources. The client sees not "the warehouse will cost 50 million," but "a warehouse of this type, in this region, on this schedule costs from X to Y, with a median of Z, and here is where the budget most often blew out on comparable projects." And even a rough estimate here will be valid: the client does not mind learning the order of magnitude of price and schedule, even with an error of 60-100% (in the ranges of AACE International 18R-97 a 100% error is acceptable for human estimators), before going out to contractors - the way a passenger in an unfamiliar city checks the rough cost of a ride on the map on their phone before getting into a cab outside the station.
The market itself will build a living price base. The data source is not an armchair reference book updated once a year, but a stream of real market events: quotations, prices pulled through the APIs of various manufacturers, actual purchase prices, closed contracts, execution history.
A contractor will be compared first of all not on price, but on reliability. A ride is visible at once, but construction plays out over years, so the role of the instant rating is played by the track record. In the uberized model the contractor is not the sole source of "route and price," but a participant on the platform whose offer is compared against the market. And the main metric becomes not the promised figure, but the probability of actually doing the work for that money, to quality and on that schedule. Just as an Uber driver has a rating, so a contractor acquires a history: did they keep within the estimate, did they hold to the schedule, how many change orders were there.
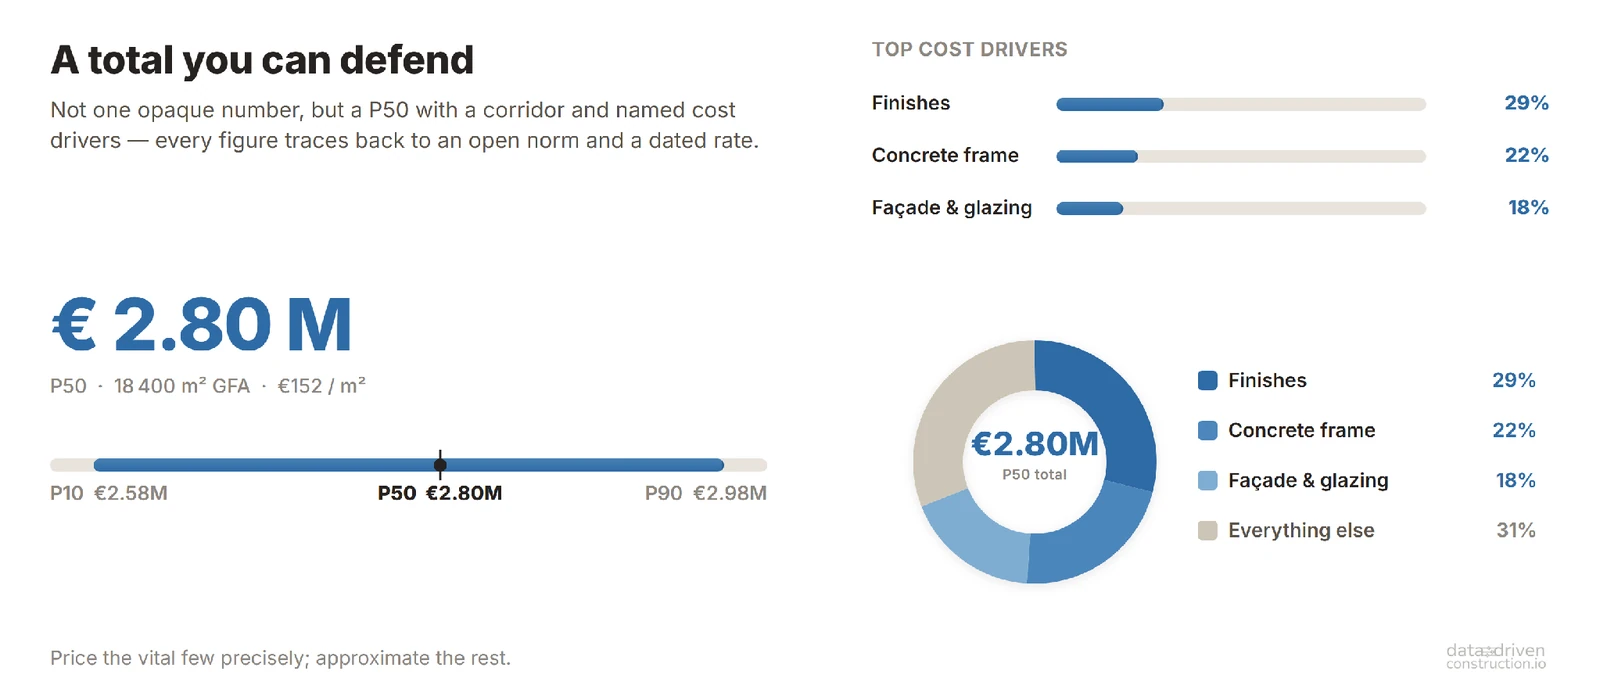
Money will drive uberization. The first to demand transparency are those who have leverage and who lose the most to opacity - investors, banks, private equity funds and large clients. They do not need yet another model viewer or pretty pictures of a building's geometry. They need a calculating machine that answers two questions in minutes: how long, and for how much money.
The speed of that machine is its main advantage. In a Dutch sample of transport projects the bulk of the cost growth fell on the pre-construction phase - the years between the decision to build and the first excavator, and each additional year of that phase added about five percentage points to the overrun. The shorter the path from decision to site, the cheaper the project - and that path shortens precisely where calculating and checking the estimate stop taking months.
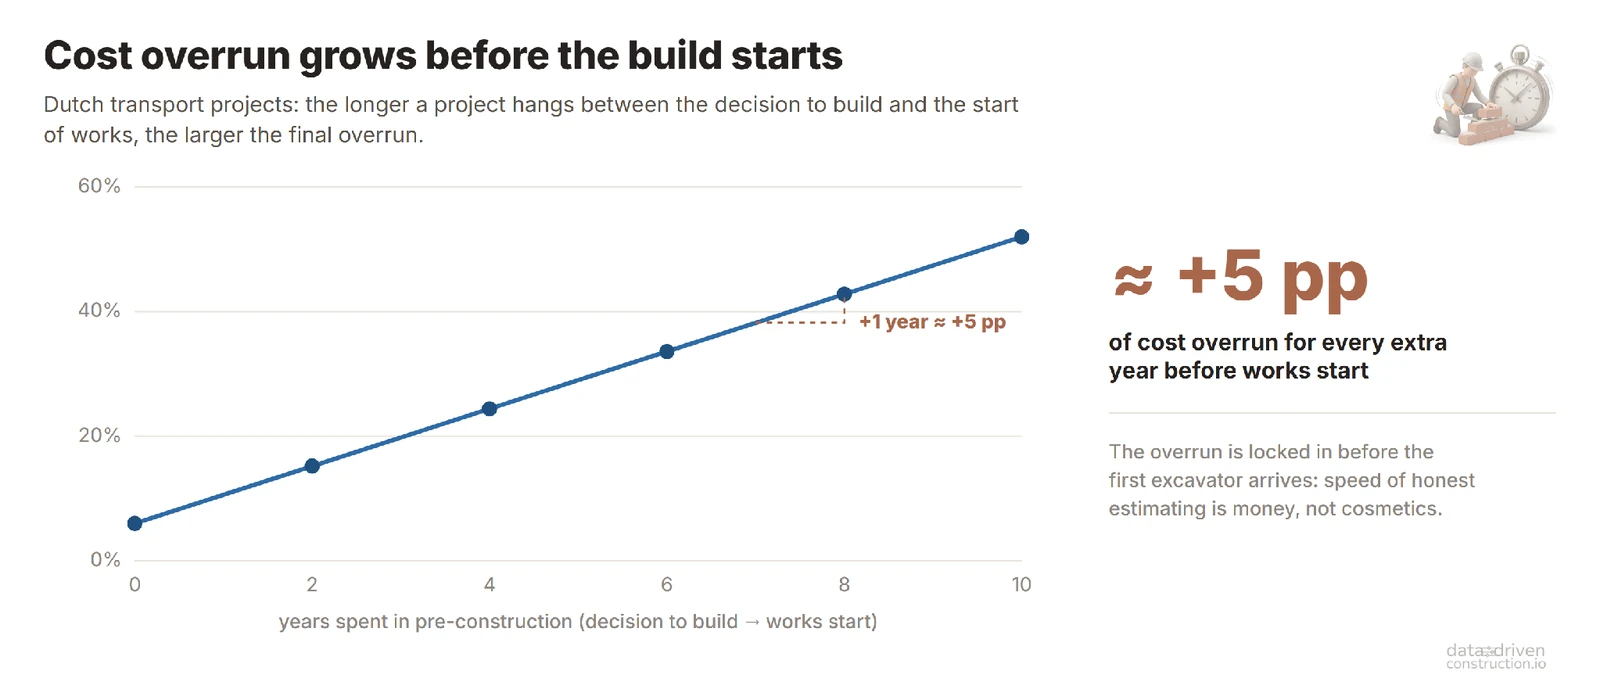
The open norm is needed not only by the client but by the one who builds - for four reasons.
First - protection against lowballing. Today an honest bid is killed by a competitor who enters the tender with an unrealistic price: afterward he either dies on the job or strangles the client with change orders. The track record makes this trick a one-off: for someone who chronically misses his own numbers, a low price stops outweighing reputation.
Second - the speed of money. The same automatic reconciliation of quantities that stops the estimate from being padded also works the other way: the client can no longer delay payment for months. What is calculated by an open norm is accepted and paid. The cash-flow gap shrinks.
Third - additional work. When the client himself changes the project, the contractor gets, for the first time, an argument that cannot be waved away: here is the norm, here is the index, here is what your change costs. The dispute over a change order turns from a battle of wills into arithmetic and work with a table.
Fourth - market entry. A proprietary base of norms and prices is what, for twenty years, separated the large contractor from a crew with skilled hands. When the norm is shared and free, a small firm no longer needs a decade of hard knocks to estimate as well as a large company.
"Investors, clients and banks are already looking for that very "Uber button" - the ability to see the real price and schedule instantly, without unnecessary middlemen.
The move toward a platform is already under way, but for now behind closed doors. Banks that finance construction have long kept their own cost databases - they have to check borrowers' estimates and sometimes invest in billion-euro projects, which they now want to be able to cost almost instantly. Large clients are already digitizing construction processes: ALDI SÜD runs construction tenders worth hundreds of millions of euros through the Berlin platform Cosuno: subcontractors' bids are gathered into a Preisspiegel - a "price mirror" with a spread of offers for each line item. Jan Riemann (ALDI SÜD), at the Handelsimmobiliengipfel (Heuer Dialog) in Düsseldorf, stated that through the digitization of tenders the discounter beat the Baukostenindex by 5% over three years.
The only question is who gets the transparency. The client will see the spread; the contractor will at best learn that his price is "above market." But which resources add up to the right price still no one sees: platforms like these usually compare the prices of finished dishes without revealing the recipes. And the data accumulates not with the market, but with a single buyer. This is already almost a navigator - only the map inside it is open to one passenger.
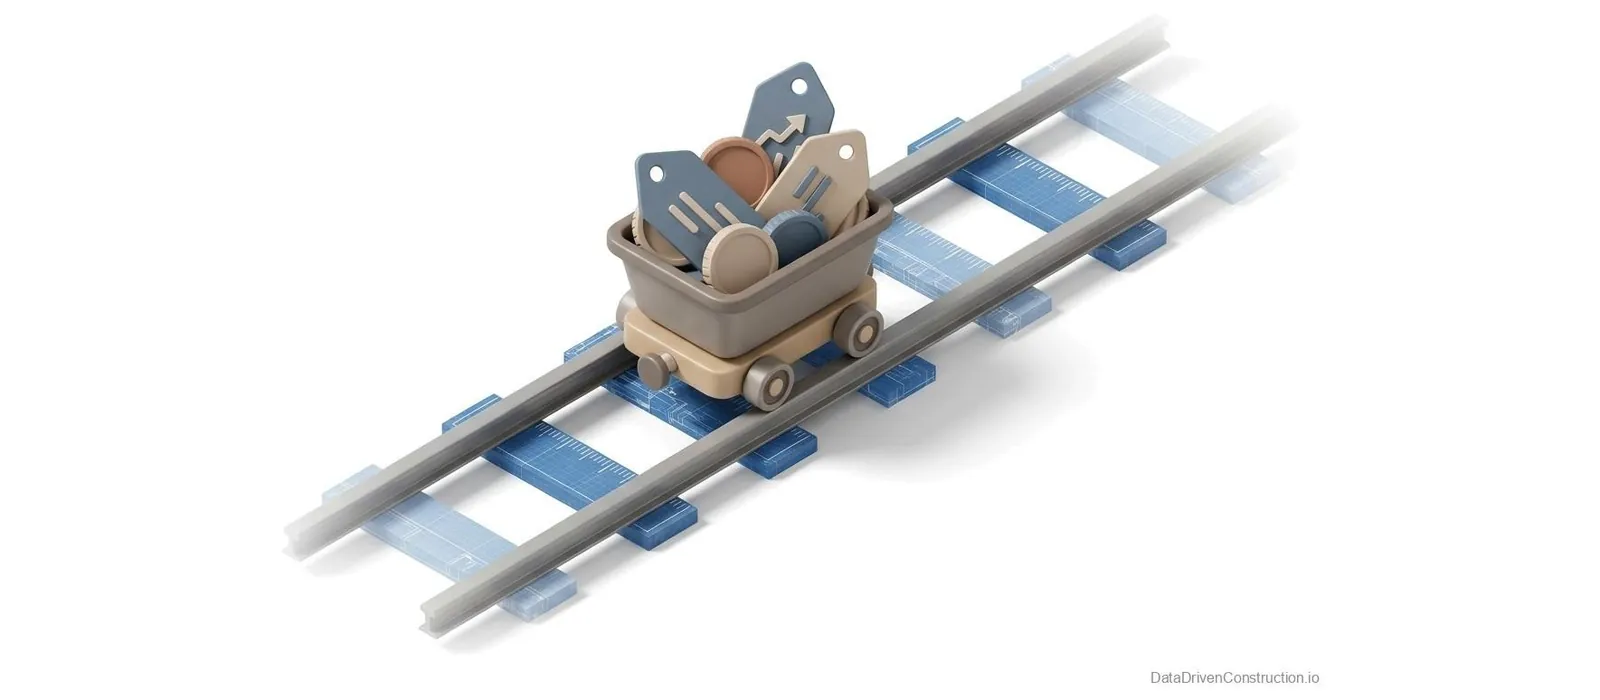
A large client (Aldi, Walmart, Deutsche Bahn, major banks) will cost projects itself. The same magic tool is being sought by this company's competitors, and in general by any investor who builds hundreds of millions' worth of same-type projects a year. The question is what the construction-and-design company will be left as in this story. Most likely an executor, responsible for the tools and the people, but no longer making its money off the client. Roughly what happened to the taxi business over 20 years.
An "Uber for construction" has already been attempted on a large scale: the American company Katerra raised more than 2 billion dollars, promised the same thing - to compress the chain and drive down the price through transparency and industrialization - and in 2021 went bankrupt, owing contractors tens of millions. What killed it was not a cartel, but the operational complexity of construction itself: underestimating how execution on site actually works, and an inability to pull developers away from their habitual, "sticky" relationships (which we wrote about above) with their subcontractors and suppliers. Almost the entire class of "Uber for X" startups died out the same way - not because of resistance from insiders, but because of economics: in taxis the supply (idle cars) already existed, and the platform only had to find it; here the key asset, data on real execution, has to be created from scratch. That is why there is still no uberization: the obstacle is not only whoever benefits from opacity - the task is objectively hard in itself. It will be moved by those who already have both a stream of same-type projects and the data on them - the very same large clients and money.
The large players will move the task, and are already moving it, but the market is not made of them: the average construction company in the European Union is a few people. A firm like that has no hope of its own Cosuno or an estimating department, yet it has to estimate constantly: dozens of small projects a year at margins of a few percent, where a single pricing error eats up the whole season's profit. The only tool of the same class it can afford is an open base of recipes from various countries: take the norm, plug in local prices, and in one evening put together an estimate you are not ashamed to lay before the client and that the client can check. Closed platforms give the magic tool to a chosen few; the open norm will hand it to everyone the market is actually made of.
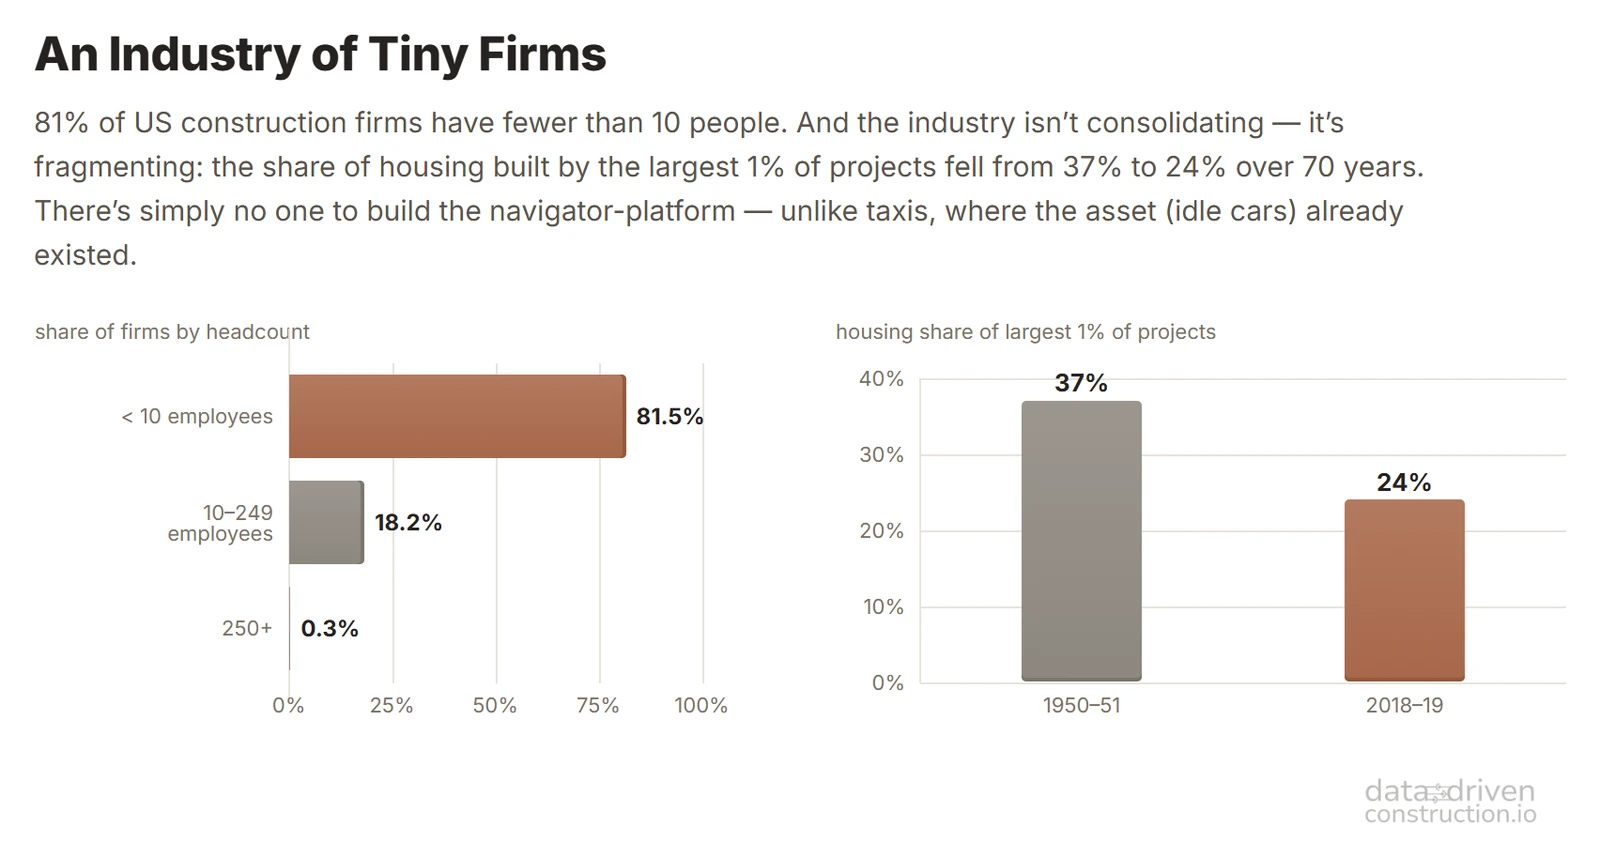
That a closed data market gets cracked open and democratized is shown by a neighboring industry - residential real estate. For decades, listings and transaction prices lived in the MLS - closed "members-only" broker databases, and the buyer saw the market through his broker's eyes. In 2006 Zillow put value estimates for tens of millions of homes into open access - today its database holds more than 160 million properties, together with the history of past sales. The brokers did not disappear, but the information monopoly ended: the buyer arrives at a viewing already knowing the price corridor. Lawsuits finished what had begun: in 2024 the realtors' association NAR agreed to pay \$418 million and change its commission rules. A similar uberization awaits the construction business too: platforms will not replace the professional, but they will strip the closed database of its monopoly on knowing the price.
What is needed for all this to work in the construction industry? The navigator is assembled from three layers. The first - open resource norms from various countries: the skeleton of every work item, broken down into labor, materials and machines. It changes rarely, together with technology, and should sit in open access (the way recipes for dishes can today be found on all sorts of free websites): without it there is nothing to build the corridor on, nothing to compare offers against, nothing to train estimation models on. The second - a living stream of local market data: real purchase prices and price spreads here and now, through APIs to suppliers or aggregators, which lay onto the skeleton of the norm and turn it into an up-to-date cost for this region and this year. The third - the contractors' track record: not the promised figure in the tender, but a real track - who held to the estimate and the schedule, and who slid into change orders; that very driver's rating that construction still does not have. Add the three layers together, and what you get is not a reference book but a map. The uberization of construction will be impossible without that very unit of measurement that the market, in the 20th century, hid behind a lumped-together price.
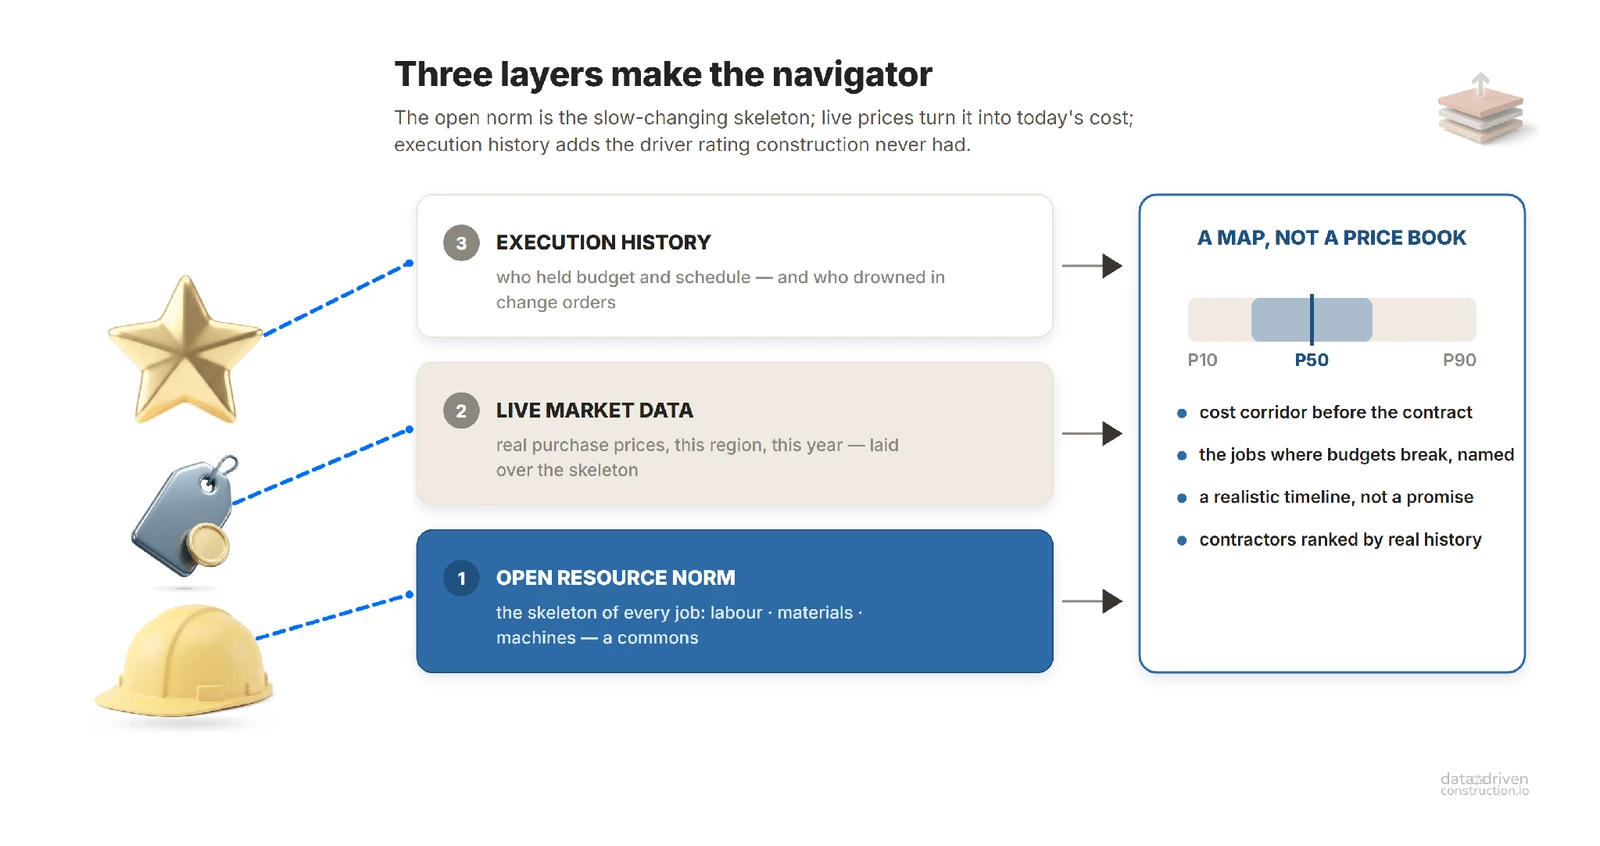
In lieu of a conclusion: whose stopwatch now
Around 2100 BC a Sumerian scribe reconciles the norm-versus-actual balance for a construction crew. In 1103 a Song-dynasty official prints labor norms to stop padded claims. In 1688 Vauban breaks earthworks down into operations for the sake of a fair price. In 1899 Taylor stands with a stopwatch over a worker with a shovel. In 1933 Turkey begins its own schedule of unit rates. By 1986 ENiR describes every operation of an enormous country to the hundredth of a man-hour. And in 2026 nine out of ten megaprojects in the world still run over budget, because the client still cannot see the real cost of construction before it begins. Like a taxi passenger in 1995, before Uber.
The uberization of construction will arrive at the moment when knowledge of cost moves out of the heads of foremen, estimators and buyers onto the client's screen: the question of "how much, and for how much" will be on the table before the contract is signed; the client will stop being a guinea pig; the contractor will be compared by a real track record rather than by a promised figure. This is the next step for an industry that is one of the last among the big ones to be left without its own Uber.
"The journey of the investor and the client from idea to finished building will become akin to travel on autopilot - with no driver in the form of a construction company, regardless of speculation and uncertainty." - from the book Data-Driven Construction
Those who are used to making money on secrecy and "coefficients" will leave. Their place will be taken by new companies, like the new taxi fleets after Uber: they will make their money on the volume and quality of their calculations, not on the client's ignorance. For the builder himself this is not a life of scraping by. Even today, opacity does not give the contractor a fat margin - it gives a volatile one: one project in the black, the next can bury the company. Uberization will trade this lottery for predictable percentages at many times less risk: fewer disputes, fewer change orders, fewer lawyers. What is compressed is not the builder's earnings, but the markup for ignorance and the cost of conflicts.
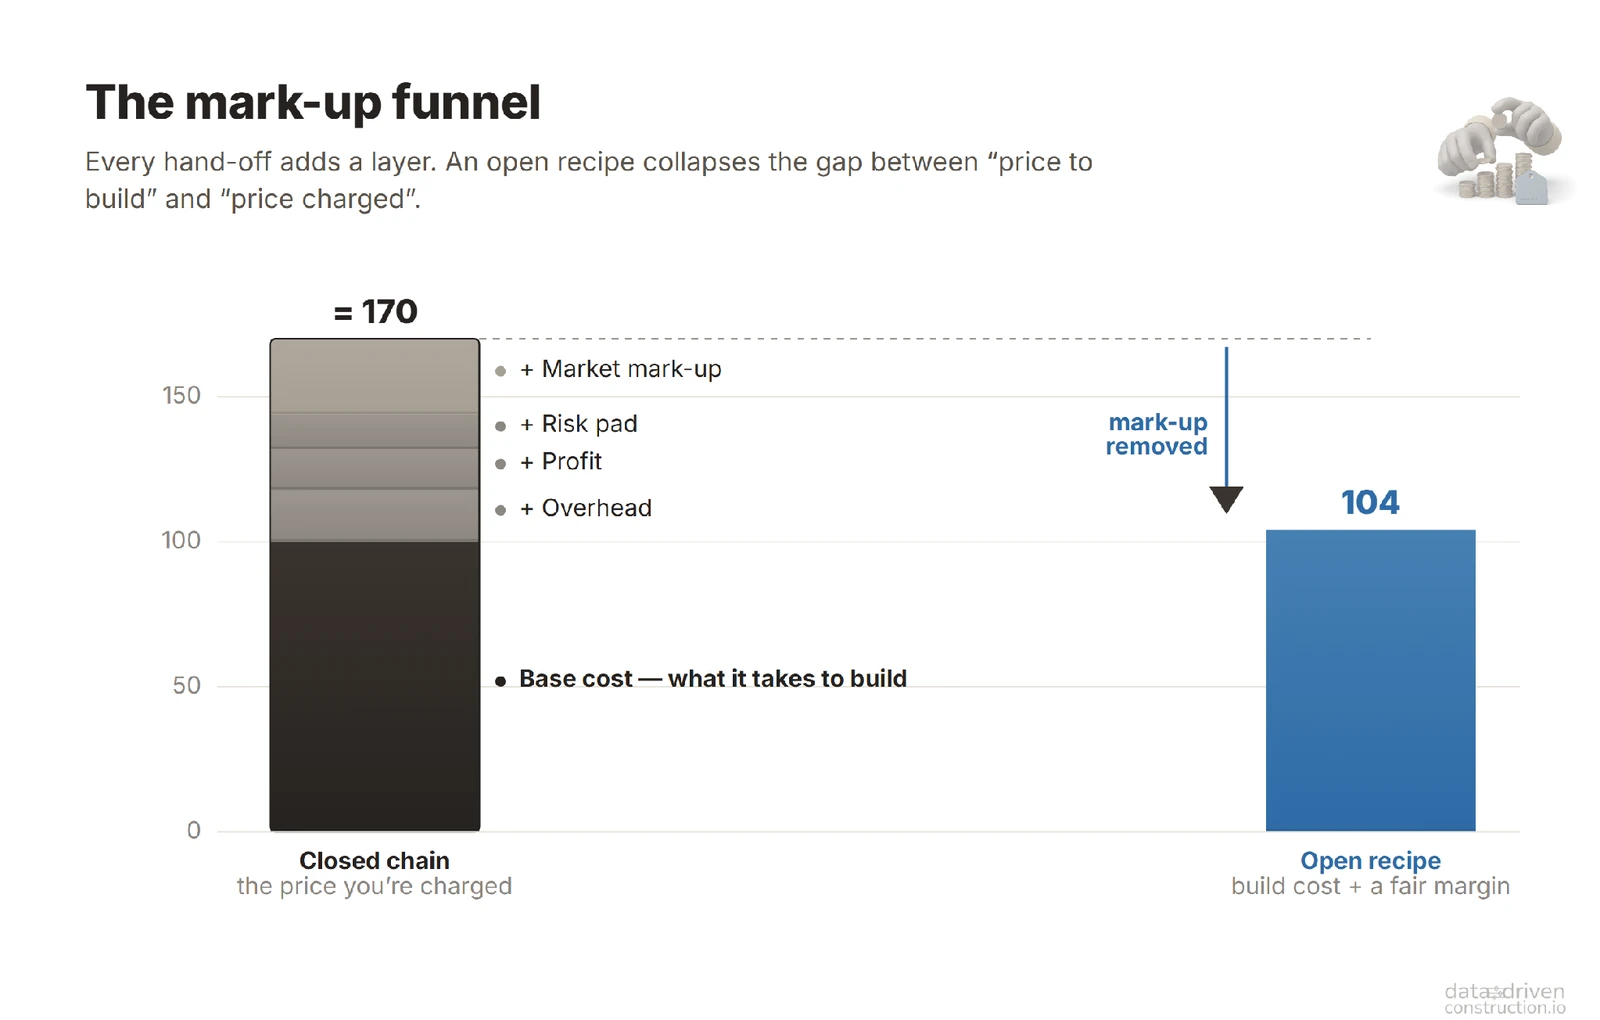
For this step toward uberization to happen, a foundation is needed - open resource norms. For four thousand years humanity accumulated this knowledge. Today most of it lives in the paid subscriptions of Western reference books, and that is normal for a market that for decades valued the convenience of the "price of the dish" over the transparency of the recipe. Uberization demands that this recipe be returned to common, open access, because you cannot build a shared platform on closed maps and on a closed price language that is different for everyone, like the zoo of standards of pre-revolutionary France.
On that same foundation robots, digital twins and AI estimators will run: they will need structure, and the open norm will give it to them ready-made and verifiable. Modern LLMs can pull structure out of both a PDF and a drawing, but it is one thing to guess it anew every time and quite another to lean on a shared, validated standard. The norm will turn construction from a craft that lives in people's heads into a process that can be measured and handed to a machine. HiPPO specialists will stop being oracles: in the meeting room, decisions will be made not by the loudest and not by the "most expensive" voice, but by data that anyone can check.

The role of the builder himself is changing too. The executor was always the object of the norm: Taylor's stopwatch stood over the worker, the resource handbook came down from above, the manager kept control. Now, for the first time, the crew will see the norm, the market price of its own work, and its own track record - and will take the margin itself, instead of handing it to a middleman for "knowing the prices." For the first time, the builder himself should become the owner of the norm.
The same change awaits the estimator. Earlier he appeared in the unflattering role of a "financial juggler," forcing the total with coefficients to match a figure set from above. When the price becomes a corridor and the estimate a forecast, the one in short supply is the person who can read the norm: the makeup of the crew, the output rate, the consumption, the limits of applicability. The estimator will steer the corridor, check the meaningful twenty percent of the lines, and defend the estimate with data rather than with the words "that's how it's done around here." The juggler leaves; the navigator stays.
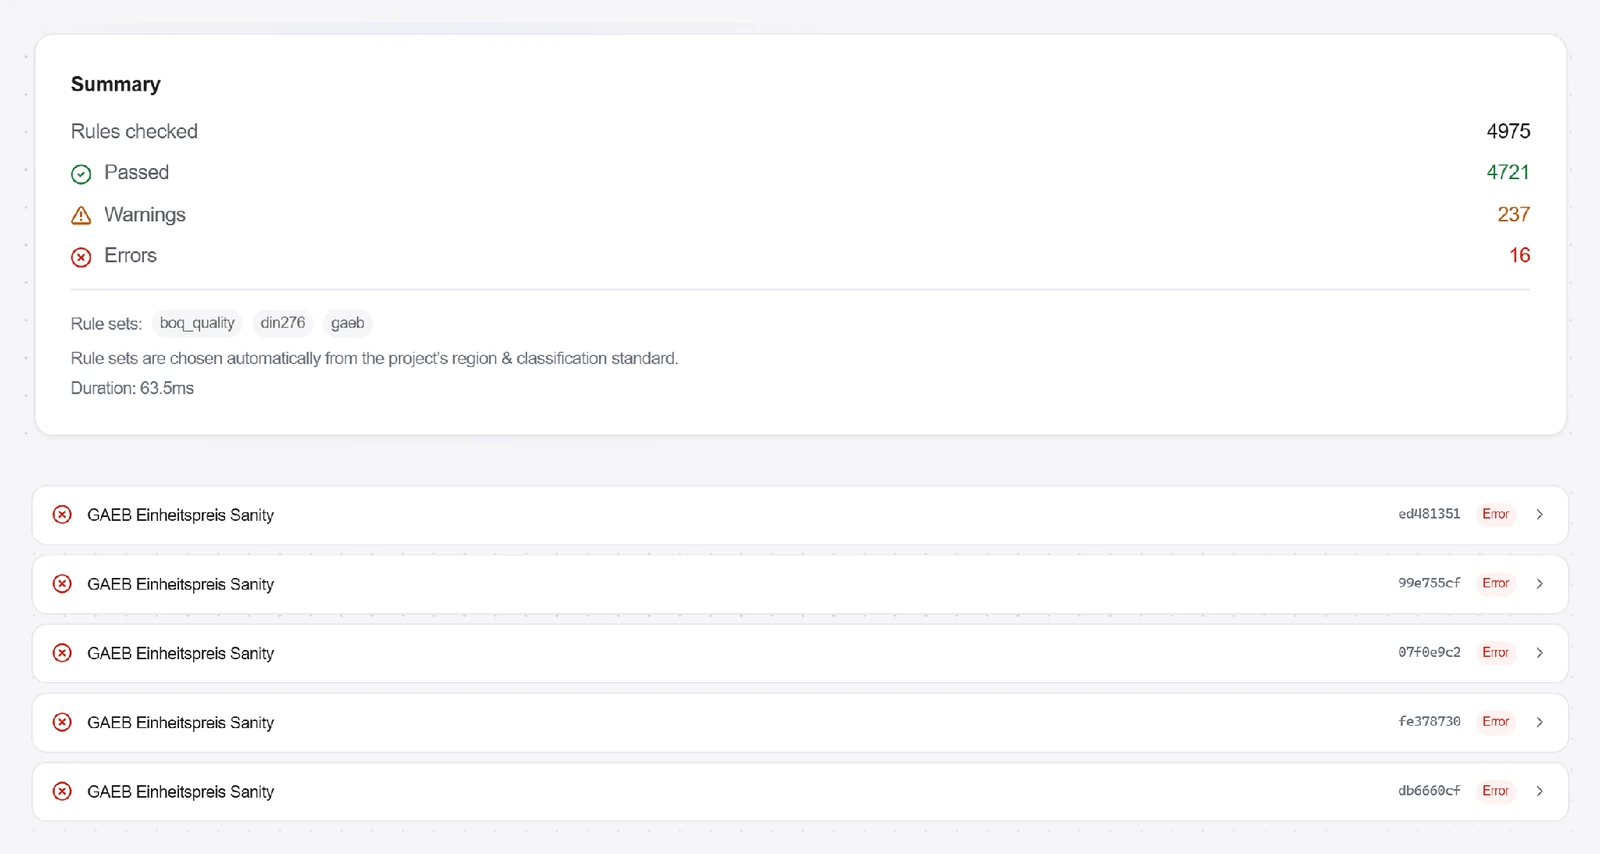
At the start of the last century Taylor formulated his principle like this: "In the past the man has been first; in the future the system must be first". This was an ideology of subordinating the human to the norm, and for it Taylorism was justly criticized throughout the 20th century. Uberization on open data turns this formula on its head. When the norm is closed and handed down from above, the system stands over the human, and there is no arguing with it. When the norm is open and market data is visible to all, the human returns to first place: the client, who can check the price; the contractor, whose work is visible through its track record; the engineer, who will recompute the norm for his own project and his own rates.
This is Taylor in reverse: not a system that the human serves, but a system that serves the human, because he can see straight through it.
The measurement of labor was born among builders: with the fortification engineer Vauban, with the bridge-builder Perronet, with the mason Gilbreth. For four thousand years it wandered from hand to hand: from the Sumerian tablet to ENiR and 定额. Now it is returning to builders, and it must return open.
This article continues a line of thought that I carry through my writing about data in construction.
In design, it is the shift from proprietary CAD formats to open ones. In money, it is the shift from a closed price to the open genome of construction work and to a navigator platform built on top of it. The movement is one and the same: to make verifiable what was taken on faith for centuries - so that the conversation about construction turns from belief into calculation.
Everything this article is about is, for us, not theory. On these principles is built OpenConstructionERP - an open and free ERP system: inside are the main open resource databases of nine countries in a convenient structured format, a link to CAD/BIM data, and more than 150 modules that cover almost any business case of a construction company. Two words are the crux here - "open" and "yours": the code is open, the data stays with you, and the system runs anywhere - on a laptop, on a company server, on any VPS. We develop it together with the community: feedback comes in through Telegram and GitHub, and the platform grows out of the real needs of those who use it. If you want to try it or join in - the website and the GitHub repository are open, as are the open resource databases.

The measurement of labor was born among builders: with the Egyptian estimators, with the fortification engineer Vauban, with the bridge-builder Perronet, with the mason Gilbreth. For four thousand years it wandered from hand to hand: from the Sumerian tablet to ENiR and 定额. Now it is returning to builders, and it must return open. Taylor's stopwatch must become open source.
Thank you for your attention. I would be glad to discuss it in the comments.