

Estimating & costing
Price a building from a PDF
Start from a flat PDF drawing and finish with a priced, validated estimate ready to export.…
5 steps15 minOpen
 ENEnglish
 DEDeutsch
 FRFrançais
 ESEspañol
 ES-MXEspañol (México)
 ITItaliano
 PTPortuguês
 NLNederlands
 PLPolski
 CSČeština
 RUРусский
 BGБългарски
 TRTürkçe
 SVSvenska
 NONorsk
 FISuomi
 DADansk
 ARالعربية
 ZH中文
ZH中文 JA日本語
JA日本語 KO한국어
KO한국어 HIहिन्दी
 THไทย
THไทย VITiếng Việt
 IDBahasa Indonesia
 RORomână
 HRHrvatski
 MNМонгол
 ETEesti
 BNবাংলা
 KKҚазақша
 KYКыргызча
 FILFilipino
 URاردو
 FAفارسی
 HEעברית
 ELΕλληνικά
Turn a single-point estimate into a range, run a Monte Carlo over the genuinely uncertain lines, read the P50 to P90 spread and set a contingency you can defend line by line.
3 steps across the platform - what you do at each one, and why it matters.
Check the bill is complete and fully priced first, then mark the handful of lines that are genuinely uncertain, whether in quantity, in rate or in ground conditions you cannot yet see.
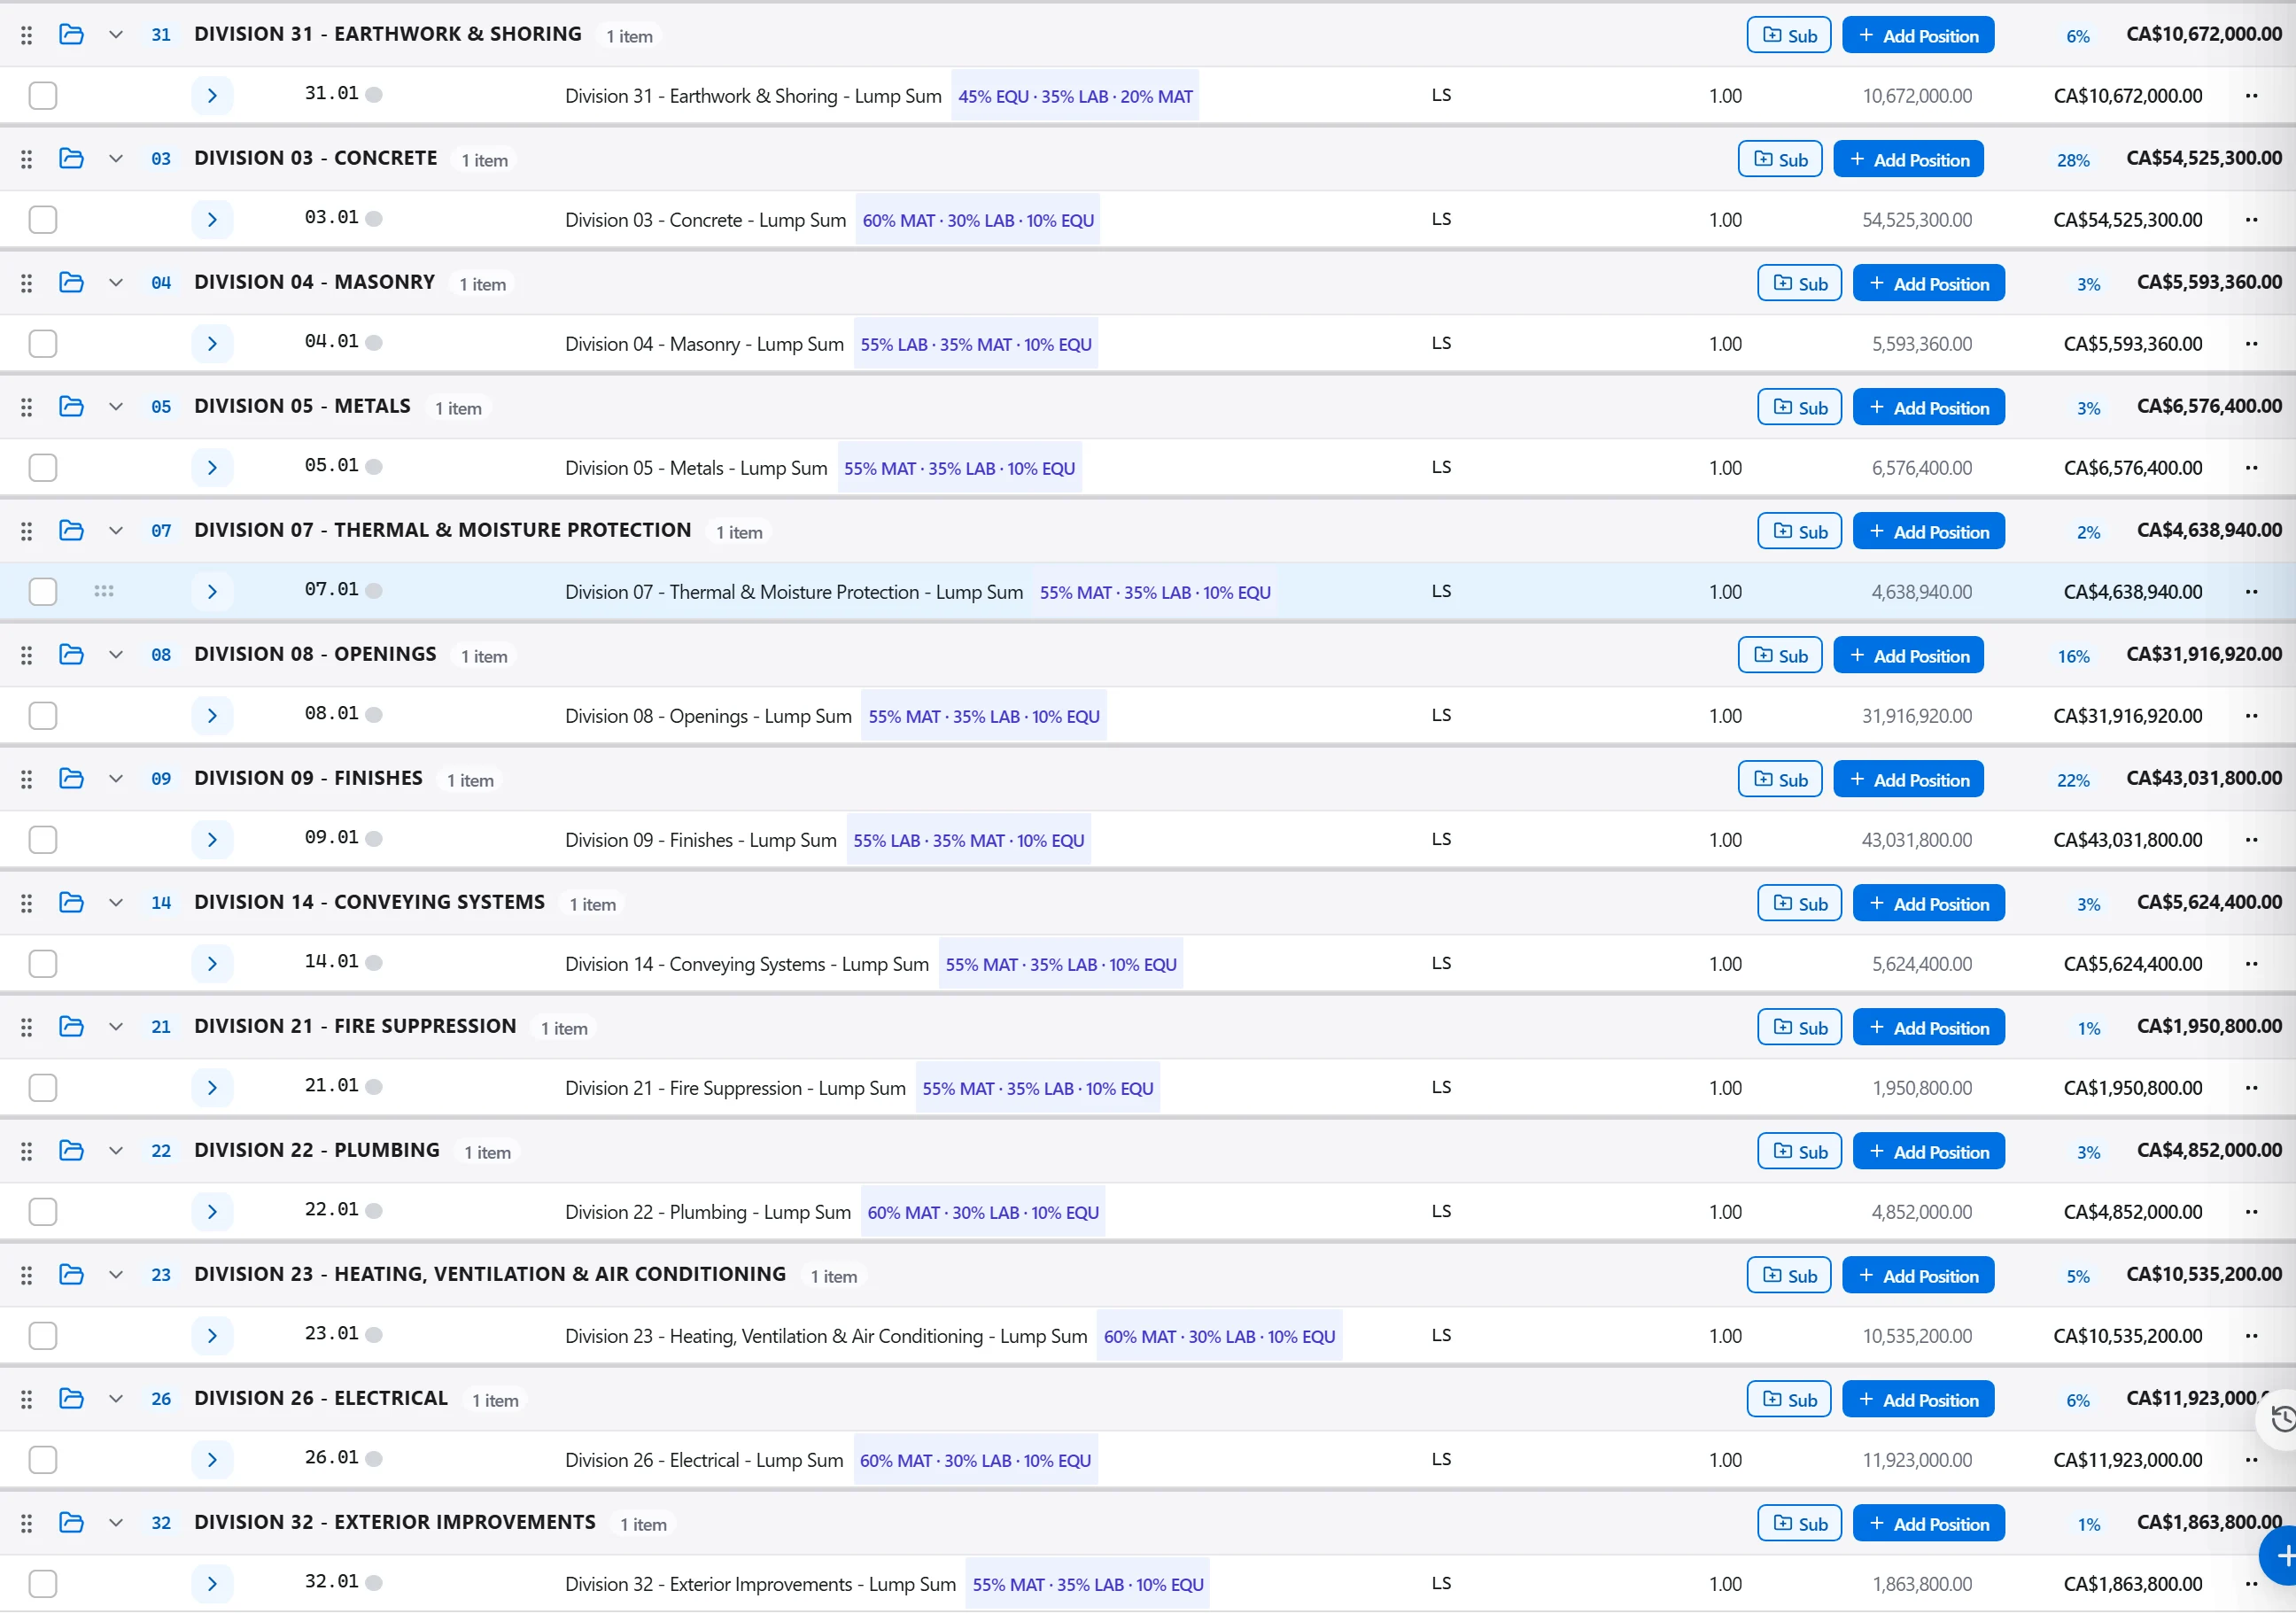
Why: Running risk over a bill with gaps or errors just dresses that error up in a confident looking curve. A clean, complete base estimate is the only thing that makes the resulting range worth trusting.
Give each uncertain line a low, most likely and high value, link the ones that move together such as fuel and haulage, then run the simulation across thousands of iterations to build a cost distribution.
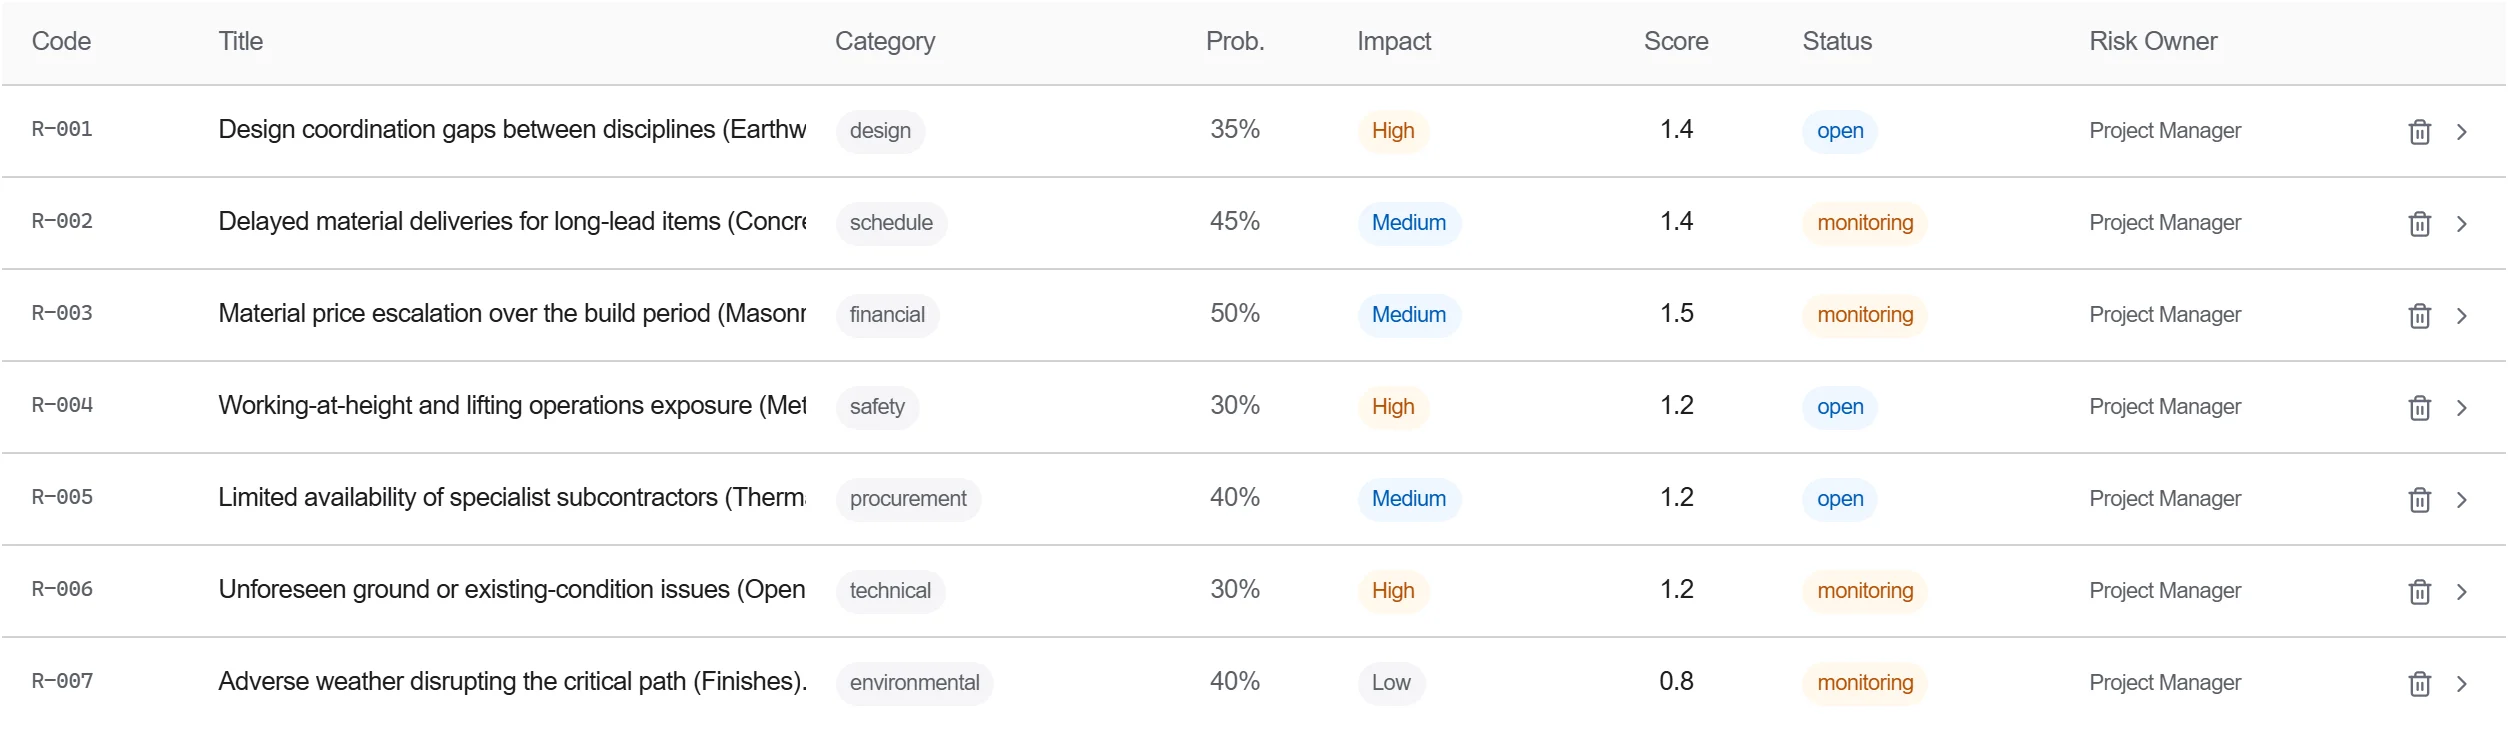
Why: A single headline figure hides how much the outturn could swing. The P50 to P90 curve tells you plainly how much cover you need to carry to hit a confidence level you are willing to sign up to.
Choose the confidence level the job warrants, read the contingency that point on the S-curve implies and export the tornado chart that ranks the biggest drivers of the spread.
Why: A contingency drawn from a distribution holds up in front of a board or a client in a way that a flat ten percent never does. The tornado shows exactly which risks the money is set aside for, so the number reads as reasoned rather than padded.
3 / 190 platform modules
Start from a flat PDF drawing and finish with a priced, validated estimate ready to export.…
Put a priced bill through the validation rules, clear every warning and error, then export…
Pull priced items from a real cost database, build the bill from them, bundle recurring bui…